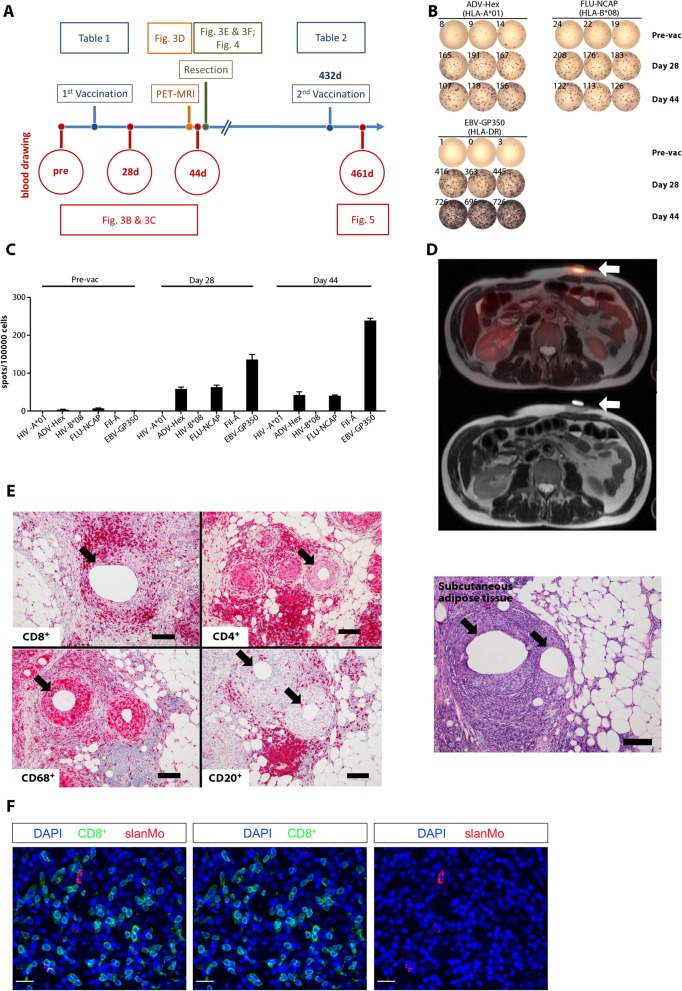
Fig. 3.
A single vaccination with peptides and XS15 induces a granuloma and local immune cell infiltration with functional T cells. (a) Time line providing an overview on blood and tissues samples as well as analyses described subsequently and interventions performed (i.e. vaccination, 18F-FDG-PET-MR imaging/ granuloma resection). Vaccinated peptides used at each time point are provided in Tables 1 & 2, respectively; Pre (before vaccination); d (day after first vaccination). (b) Induction of functional T cells by XS15 detected in ex vivo ELISpot: PBMCs were isolated from peripheral blood of a volunteer before vaccination (pre-vac), 28 days and 44 days after vaccination. IFNγ response towards the three vaccine peptides (ADV-Hex, FLU-NCAP and EBV-GP350) was determined in two ELISpot assays (Pre-vac + 28d, and 44d). HIV-A*01, HIV-B*08 and Fil-A peptides served as the relevant negative controls. 300,000 cells were seeded per well. Phytohemagglutinin-L (PHA-L) stimulation was used as a positive control (ELISpot plate wells rearranged, and negative controls left out). (c) Respective mean spot counts and SD/100,000 cells per well are shown. (d) Granuloma formation at the vaccination site: 18F-FDG-PET/MR (upper panel) performed on day 43 demonstrated an intense 18F-FDG uptake at the site of the induration (standardized uptake value ((SUV(mean) 4.6; SUV(max) 6.4), but no 18F-FDG-uptake was observed in the draining lymph nodes or in any other secondary lymphoid organs; corresponding MR (lower panel). (e) Immune cell infiltration of the granuloma induced by vaccination: A tissue sample from the granuloma center was processed as formalin-fixed paraffin-embedded (FFPE) tissue and assessed by hematoxylin & eosin (HE) staining (right) and immunohistochemistry (left). T cells (CD8+ and CD4+), B cells (CD20+) as well as macrophages (CD68+) and granulocytes appeared as ordered structures in separated areas resembling lymphoid tissues. Mineral oil deposits (black arrows) were still discernible, surrounded by macrophages, whereas both CD4+ and CD8+ T cells were located closely to the macrophages but separated from the oil patches. Original magnification was × 100. Black scale bars indicate 200 μm. (f) Co-localization of slanMo and CD8+ T cells in the granuloma. Immunofluorescence staining was performed to detect slanMo and CD8+ lymphocytes in the granuloma of the XS15-vaccinated volunteer. As representative examples, images of single CD8+ T cell or slanMo stainings as well as merged images are shown. Original magnification was × 400. White scale bars are 20 μm

