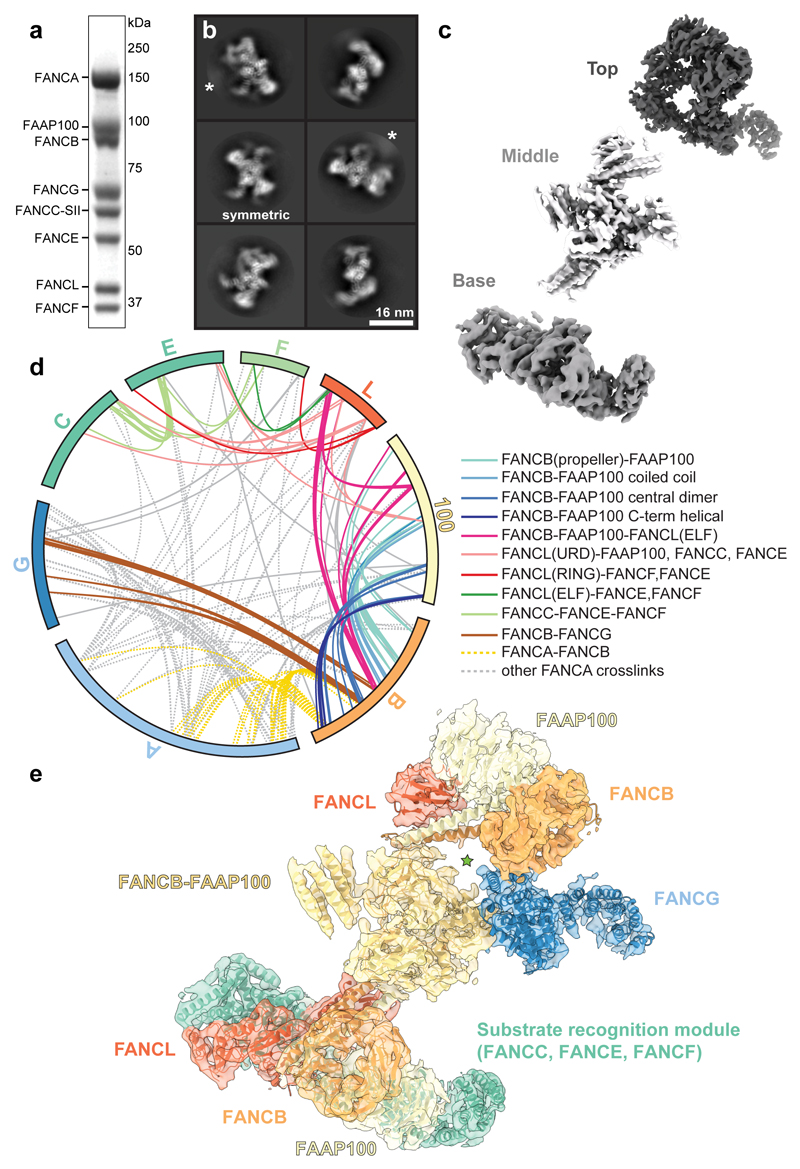
Fig. 1. Overall structure of the FA core complex.
a SDS-PAGE analysis of purified FA core complex with subunits and molecular weight markers indicated. FANCC carries a 2x Strep II tag on its C-terminus (FANCC-SII). This purification was repeated more than three times with similar results. For gel source data, see Supplementary Fig. 1. b Selected 2D reference-free class averages of the FA core complex. One class appears to be symmetric (labelled). Asterisks mark disordered density extending from the side of the complex that does not align well. c Focused classification and refinement on the top and base regions, and multibody refinement on the middle region resulted in three independent cryoEM maps that are shown separately, in three different shades of grey. d Crosslinking mass spectrometry revealed 834 crosslinks (1% FDR) between residues that are in close proximity. Intermolecular crosslinks are shown, colored by interacting regions. e Model of FA core complex (cartoon representation) fitted into the EM density (isosurface representation with transparency). Map and model are colored by assigned subunits. The green star marks a channel with diameter ~23 Å.

