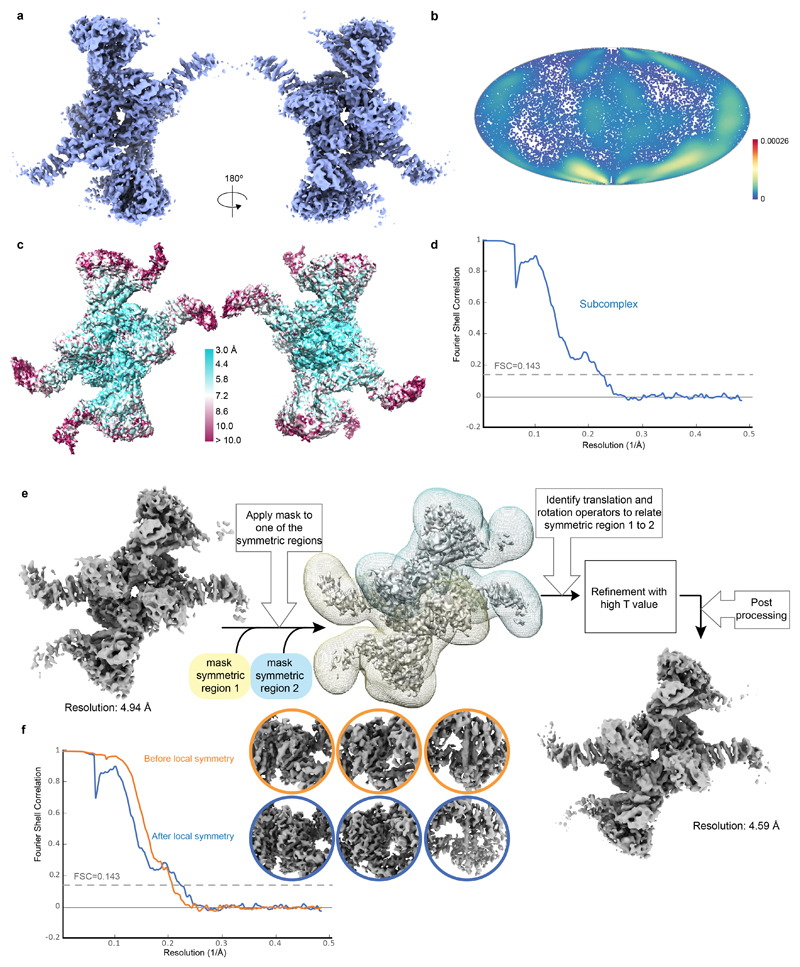
Extended Data Fig. 7. 3D reconstruction of symmetric FA subcomplex and local symmetry refinement.
a Overall 3D reconstruction of the symmetric FA subcomplex. b Angular distribution plot of particles used in the 3D reconstruction of the symmetric FA subcomplex. Every point is a particle orientation and the color scale represents the normalized density of views around this point. The color scale runs from 0 (low, blue) to 0.00026 (high, red). The efficiency of orientation distribution67, EOD, was 0.65. c Estimated local resolution map for symmetric FA subcomplex. d Fourier shell correlation plot for gold standard refinement. e Local symmetry pipeline for reconstruction of the symmetric FA subcomplex (see Methods). This reconstruction could not be improved with C2 symmetry, likely because of local flexibility. f Fourier shell correlation plot for gold standard refinement shown for the subcomplex reconstruction before and after local symmetry refinement. The circular panels show representative densities before and after local symmetry refinement.

