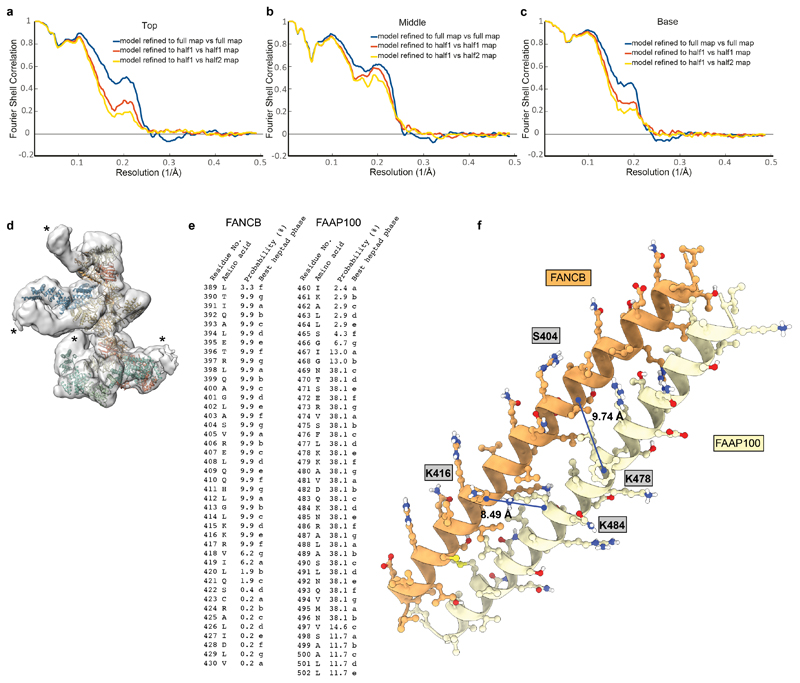
Extended Data Fig. 5. Assessment of model fit in maps and modelling of coiled coils.
a–c Fourier shell correlation (FSC) plots of maps vs model for top (a), middle (b) and base (c) regions. d Low-resolution cryoEM map of FA core complex (transparent surface) with models placed in the map. Asterisks represent density that was not visible at high resolution and was not interpreted. This may represent FANCA and additional parts of the substrate recognition module. e MARCOIL51 prediction for the best heptad phase in the long helices of FANCB and FAAP100. f Predicted coiled-coil model by CCbuilder 2.053 for the FANCB and FAAP100 long helices. Crosslinks detected for these helices in the FA core complex crosslinking mass spectrometry are indicated with blue lines.

