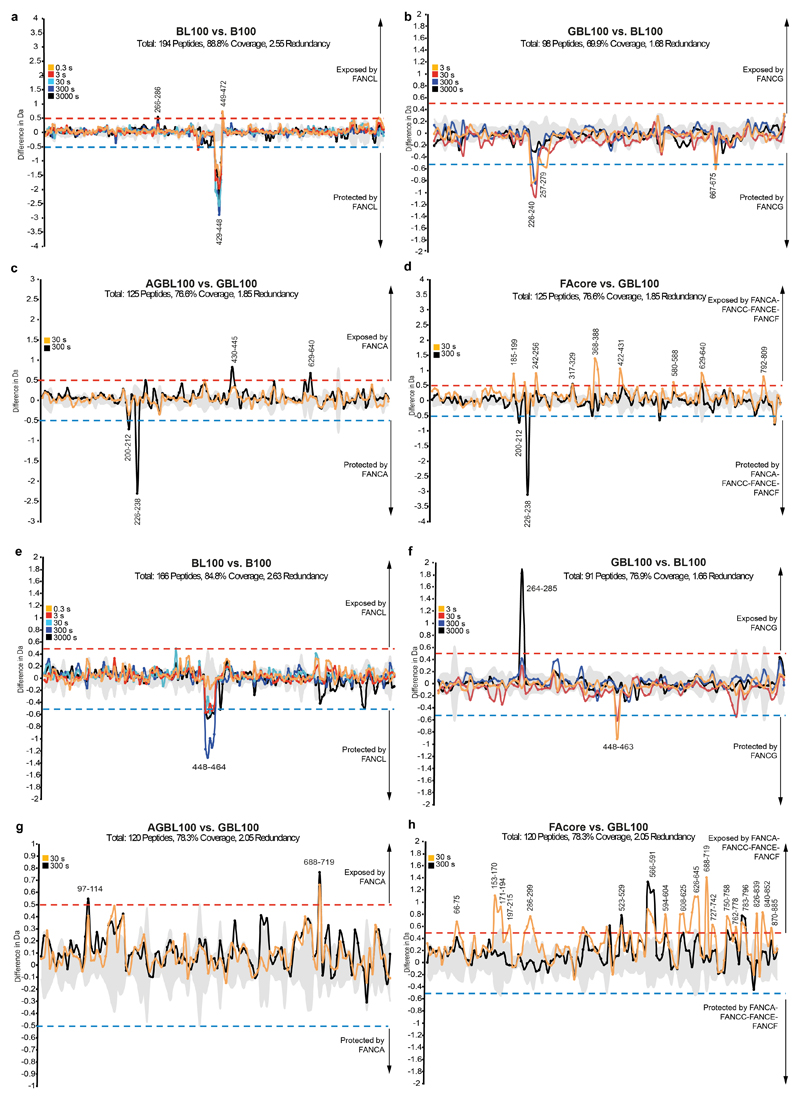
Extended Data Fig. 6. Hydrogen deuterium exchange mass spectrometry on FANCB and FAAP100.
a–d Difference plots for FANCB showing peptides that are protected (negative) or exposed (positive) upon binding of additional subunit(s) for (a) B-L-100 vs B-100, (b) G-B-L-100 vs. B-L-100, (c) A-G-B-L-100 vs. G-B-L-100, and (d) FA core complex vs. G-B-L-100. Exchange of hydrogens in FANCB residues 429–448 was protected after interaction with FANCL, consistent with FANCL being located next to the coiled coil. e-h Difference plots for FAAP100 showing peptides that are protected (negative) or exposed (positive) upon binding of additional subunit(s) for (e) B-L-100 vs B-100, (f) G-B-L-100 vs. B-L-100, (g) A-G-B-L-100 vs. G-B-L-100, and (h) FA core complex vs. G-B-L-100. Exchange of hydrogens in FAAP100 residues 448–464 was protected after interaction with FANCL, consistent with FANCL being located next to the coiled coil. For difference plots, triplicate data from four independent color-coded time-points are shown. The significance threshold is indicated by dashed lines. Grey shading indicates the standard deviation of all charge states and replicates per peptide. Sequence coverage is shown in Supplementary Data.

