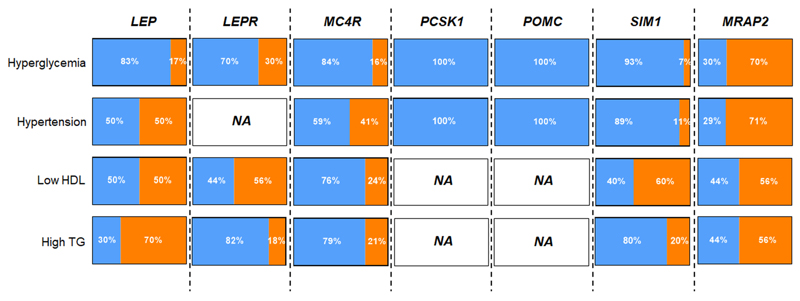
Figure 2. Rate of hyperglycemia, hypertension, low HDL and high TG in patients deficient for LEP, LEPR, MC4R, PCSK1, POMC, SIM1 or MRAP2.
HDL, high-density lipoprotein; NA, not available; TG, triglyceride.
Orange areas show rates of hyperglycemia, hypertension, low HDL and high TG, while blue areas show rates of normal glucose, normal blood pressure, high HDL and low TG.
This figure was generated from Table 2 (for MRAP2 deficiency) and Supplementary Table 4 (for deficiencies of LEP, LEPR, MC4R, PCSK1, POMC and SIM1).

