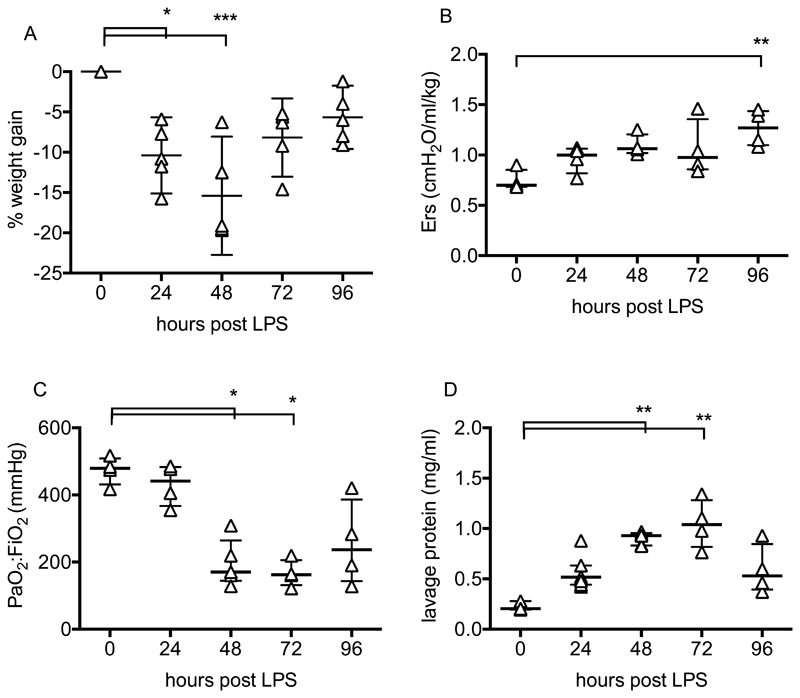
Figure 1.
Time course of LPS-induced lung injury. Body weight (A) is expressed as % increase from pre-injured levels. Elastance (Ers, B) and arterial oxygenation (PaO2/FiO2, C) were evaluated following a 30 minute period of non-injurious ventilation. Total protein (D) was determined in lung lavage fluid. N= 4-6 for each readout at each time point, so all were treated as non-normally distributed data. Data are displayed as individual points with median and interquartile range, and were analysed by Kruskal-Wallis test followed by Dunn’s multiple comparisons test. *p<0.05, **p<0.01, ***p<0.001 vs 0h (untreated mice). Exact p-values were as follows: Panel A - 24h p=0.0134, 48h p=0.0005, 72h p=0.0890, 96h p=0.3379; Panel B - 24h p=0.5720, 48h p=0.0789, 72h p=0.2730, 96h p=0.0033; Panel C - 24h p>0.9999, 48h p=0.0377, 72h p=0.0146, 96h p=0.1839; Panel D - 24h p=0.4495, 48h p=0.0092, 72h p=0.0024, 96h p=0.5134.

