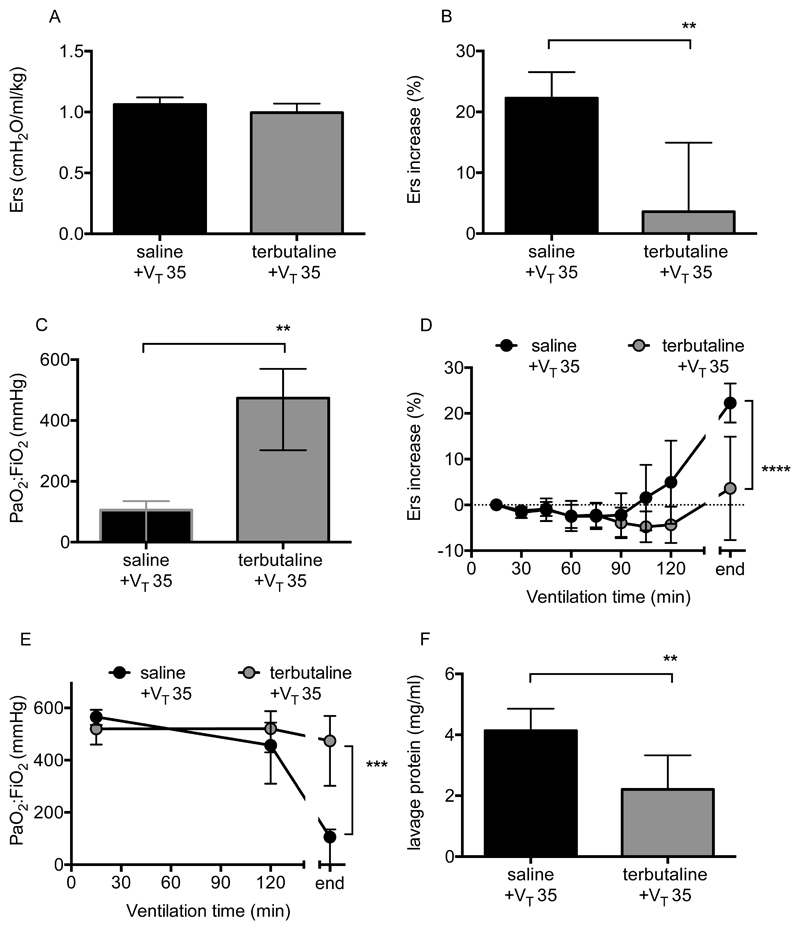
Figure 4.
Physiological parameters during pure VILI model following terbutaline treatment. Initial elastance immediately after instillation and setting high VT was no different between saline and terbutaline-instilled animals (A). Panel B shows overall elastance change and Panel C shows final arterial oxygen levels in animals following ventilation with 35ml/kg tidal volume (VT 35). As animals develop injury at different rates, time courses of elastance (D) and oxygenation (E) were also evaluated. Note that ‘end’ relates to the final value, either after 3 hours of ventilation or whenever animals met the mortality surrogate. Panel F shows protein concentration in lavage fluid taken at the end of experiments. N=6/group for all datasets. End-point data in panels A, B & F were normally distributed, analysed by t-test and displayed as mean±SD. Data in Panel C required transformation before analysis and are displayed as back-transformed mean with 95% confidence intervals. *p<0.05, **p<0.01 vs vehicle (saline) by Students t-test. Time-course data in panel D were normally distributed and displayed as mean±SD while data in panel E required transformation before analysis and are displayed as back-transformed mean with 95% confidence intervals. Time courses were analysed by 2-way ANOVA. ***p<0.001, ****p<0.0001 for interaction. Exact p-values were as follows: Panel A p=0.1432; Panel B p=0.0030; Panel C p=0.0064; Panel D p<0.0001 (interaction); Panel E p=0.0004 (interaction); Panel F p=0.0041.

