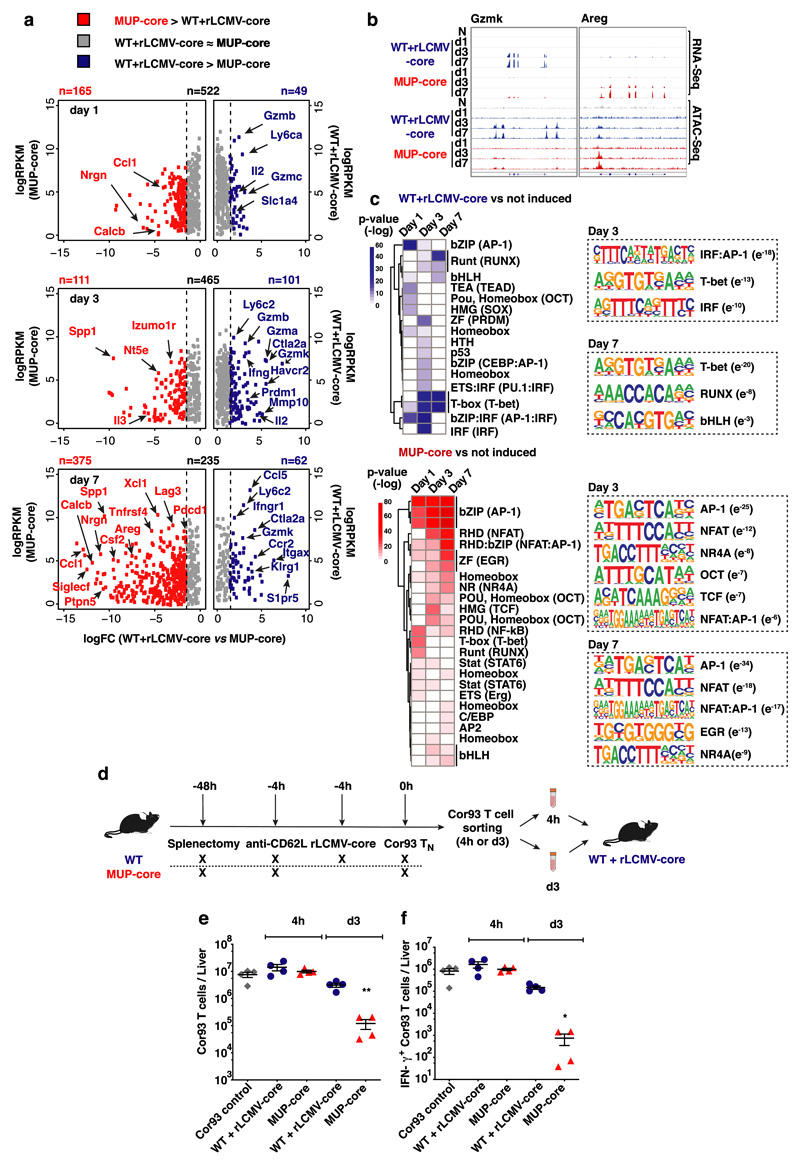
Fig. 2. Transcriptomic and chromatin accessibility analyses of CD8+ T cells undergoing intrahepatic priming.
(a) Scatter plot showing the level (y axis) and the difference in expression (x axis) of inducible genes in the dataset (versus Cor93 TN) in the indicated conditions. Genes expressed at higher levels in WT + rLCMV-core or MUP-core mice are shown in blue or red, respectively. (b) Integrative Genomics Viewer (IGV)40 snapshots showing RNA-seq and ATAC-seq data at Gzmk and Areg loci, selected as representative genes with differential expression in WT + rLCMV-core or MUP-core mice, respectively. (c) Left panels. Heatmap showing the enrichment of DNA motifs (HOMER)41 within the top 200 inducible (versus Cor93 TN) and differential ATAC-Seq peaks in WT + rLCMV-core (blue) or MUP-core mice (red). A set of 3899 non-inducible ATAC-seq peaks was used as background. Right panels. Selected enriched motifs and putative cognate transcription factors in ATAC-Seq peaks from WT + rLCMV-core (top) or MUP-core (bottom) mice. Values between brackets indicates p-value. (d) Schematic representation of the experimental setup. (e-f) Total numbers (e) and numbers of IFN-γ-producing (f) Cor93 T cells in the livers of the indicated mice.

