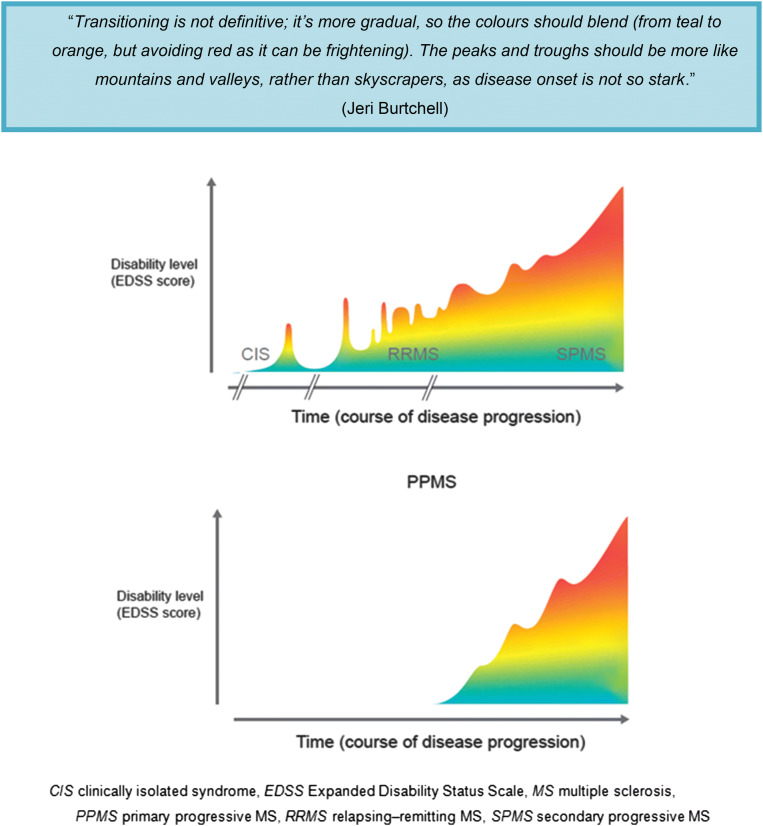
Fig. 1.
Patients’ perspectives on MS progression and subsequent schematic illustrating MS as a disease spectrum, rather than as distinct clinical forms. The figure depicts a representative course of MS disease progression from RRMS to SPMS (top) and for PPMS (bottom). Note that progression does not necessarily correlate with time; a patient can remain stable for a long period of time without their disease worsening. Importantly, disease progression takes a different course (i.e., the figure would look different) for each patient with MS

