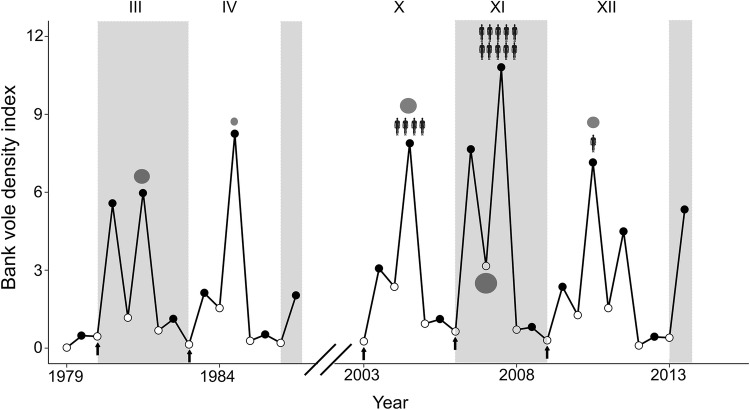
Figure 5.
Bank vole density (number of trapped individuals per 100 trap nights) in different cycles (every other cycle is shaded) in 1979–1986 and 2003–2013 in spring (open circles) and autumn (filled circles). The size of the gray circles is proportional to the maximum density of infected voles and positioned to indicate when that density was reached in a cycle (133, 72, 113, 161, 88, infected bank voles in 1981, 1984, 2004, 2007, 2010, respectively). Arrows indicate springs when we forecast the maximum density of infected bank voles, typically 18 months earlier. Human infection data were available for 2003-2013 (n = 3 cycles; see methods), and the number of human silhouettes is proportional to annual incidence of Nephropathia epidemica in northern Sweden (no. cases/100,000 inhabitants) in July to following June in the year with maximum density index of infected bank voles (466, 1278, 128 cases in 2004, 2007, 2010, respectively).

