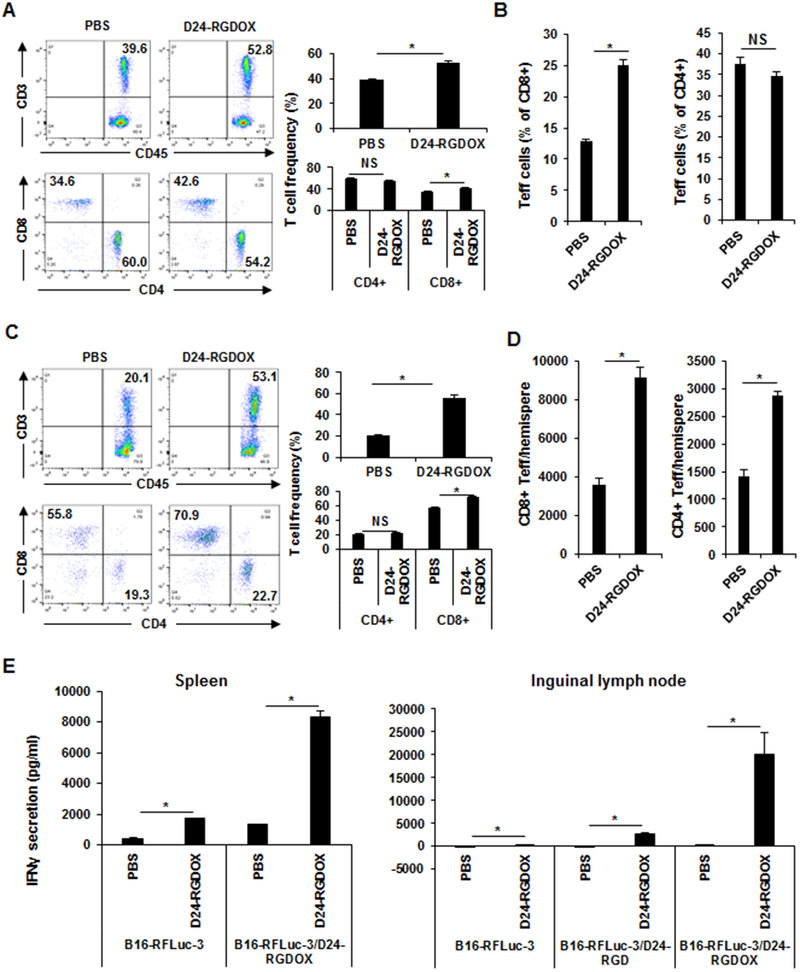
Figure 4. Systemic immune activation induced by localized Delta-24-RGDOX treatment in tumor-bearing mice.

The mice with s.c. and i.c. tumors were treated as depicted in Figure 2A. Three days after the last dose of viral injection, tissues were collected from the mice (4-5 mice/group) for immunological analysis. A-D, The leukocytes from the blood (A and B) and brain hemispheres with tumor implantation (C and D) were analyzed with flow cytometry to assess the frequency of T cells (CD3+), cytotoxic T cells (CD3+ CD8+), and T helper cells (CD3+ CD4+) (A and C); and the frequency (B) and number (D) of effector T cells. A and C, Left panel: Representative flow cytometry plots; the numbers are the frequency of the gated cell populations. Right panel: quantification of the cell populations in left panel. E, Splenocytes and cells from inguinal lymph nodes (tumor-draining lymph node of the s.c. tumor) were co-cultured with B16F10 Red-FLuc-3 cells with or without the infection of the indicated viruses. The amount of IFNγ secreted into the medium was assessed with ELISA forty hours later. D24-RGD: Delta-24-RGD; D24-RGDOX: Delta-24-RGDOX. Teff: effector T cells. Values represent means ± standard deviations (n = 3). NS: not significant (P ≥ 0.05); *P < 0.05, 2-tailed Student t-test.
