
Figure 6. Tumor-specific T-cell expansion and migration to target distant tumors mediated by localized Delta-24RGDOX treatment.
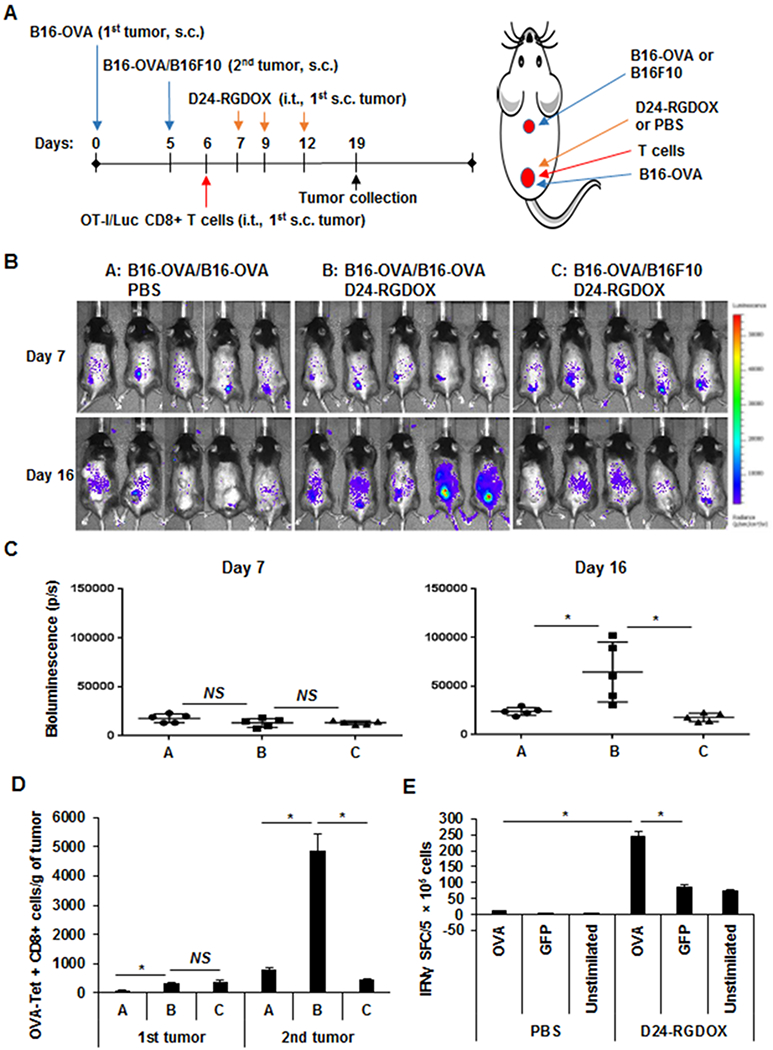
A, A cartoon depiction of the treatment scheme for the schedule (left) and position of implantation and viral injection (right). OVA-specific (OT-I/Luc) T cells (1 × 10⁶) were injected on day 6. s.c.: subcutaneously; i.t.: intratumorally. B, Bioluminescence imaging shows the distribution of tumor-specific T cells after i.t. injection of Delta-24-RGDOX in the first implanted s.c. tumor at the indicated times. C, Quantification of bioluminescence in the second untreated tumors of the mice shown in B on days 7 and 16. D, On day 19, the lymphocytes from the tumors (5 mice/group) were analyzed with flow cytometry to assess OVA-Tet+ CD8+ cells. The quantification of this cell population in the tumors is shown. Values represent means ± standard deviations (n = 3). Groups A, B, and C in C and D are the same as those indicated in B. E, OVA-specific IFNγ-producing cells detected by ELISPOT. After implantation of B16-OVA cells s.c., three doses of Delta-24-RGDOX were injected introtumorally on Days 7, 9, 11. On Day 16, splenocytes were isolated from the mice (3 mice per group) and stimulated with indicated peptides. IFNγ spot-formaing cells (SFC) were measured using an IFNγ ELISPOT assay. D24-RGDOX: Delta-24-RGDOX; NS: not significant (P ≥ 0.05); *P < 0.05, 2-tailed Student t-test.