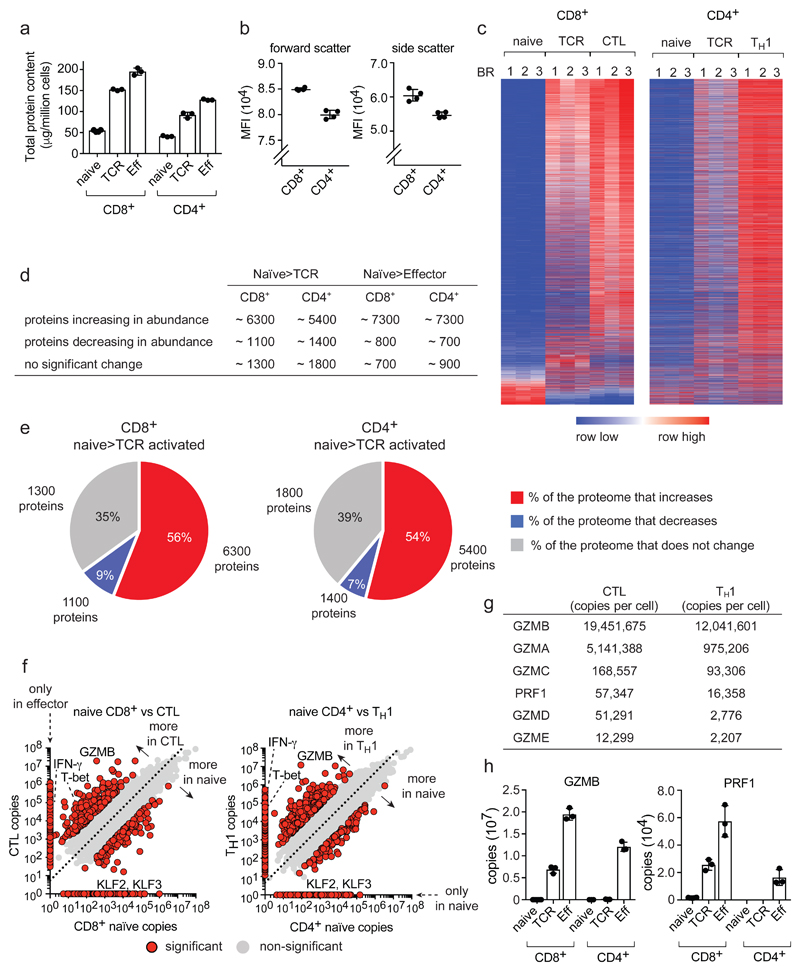
Figure 1. Proteome re-modelling during T cell differentiation.
(a) Total protein content of naïve, 24 h TCR-activated (TCR) and effector (Eff) populations. (b) Mean fluorescence intensity (MFI) of forward/side scatter for naïve CD4+ and CD8+ T cells. (c) Heat map of CD4+ and CD8+ proteomes during differentiation. The full list of proteins within the heat map is provided in Supplementary Data File 1. (d) Number of proteins changing in abundance during T cell differentiation: naïve to TCR activated and naïve to effector (P value <0.05, fold change >1.5 (two-tailed t-test with unequal variance) or presence/absence expression). (e) The proportion of the cell mass that corresponds to proteins increasing, decreasing or not changing in naïve cells in response to TCR triggering. The number of proteins in each category is also provided. Proteins were categorized as changing as described above. (f) Protein copy number comparisons between naïve and effector populations for CD4+ and CD8+ T cells. Proteins highlighted in red are significantly different between naïve and effector or show a presence/absence expression profile (P value <0.05, fold change >2 standard deviations from the mean fold change, two-tailed t-test with unequal variance). Proteins that were not detected in one population are positioned on the axis and are highlighted in red. The dashed line = mean fold change between naïve and effector. Interferon-γ (IFN-γ), granzyme B (GZMB), T-bet (TBX21) and Kruppel-like factor 2 and 3 (KLF2 and KLF3). (g) Abundance of effector molecules in CTLs and TH1 cells. (h) Abundance of GZMB and perforin (PRF1). For a, d, e, f, g and h, n = 6 biologically independent samples for CD8+ naïve cells and 3 biologically independent samples for each of the other T cell populations. For b, n = 4 biologically independent samples. For c, n = 3 biologically independent samples for each T cell population. Histogram bars represent the mean +/- SD.

