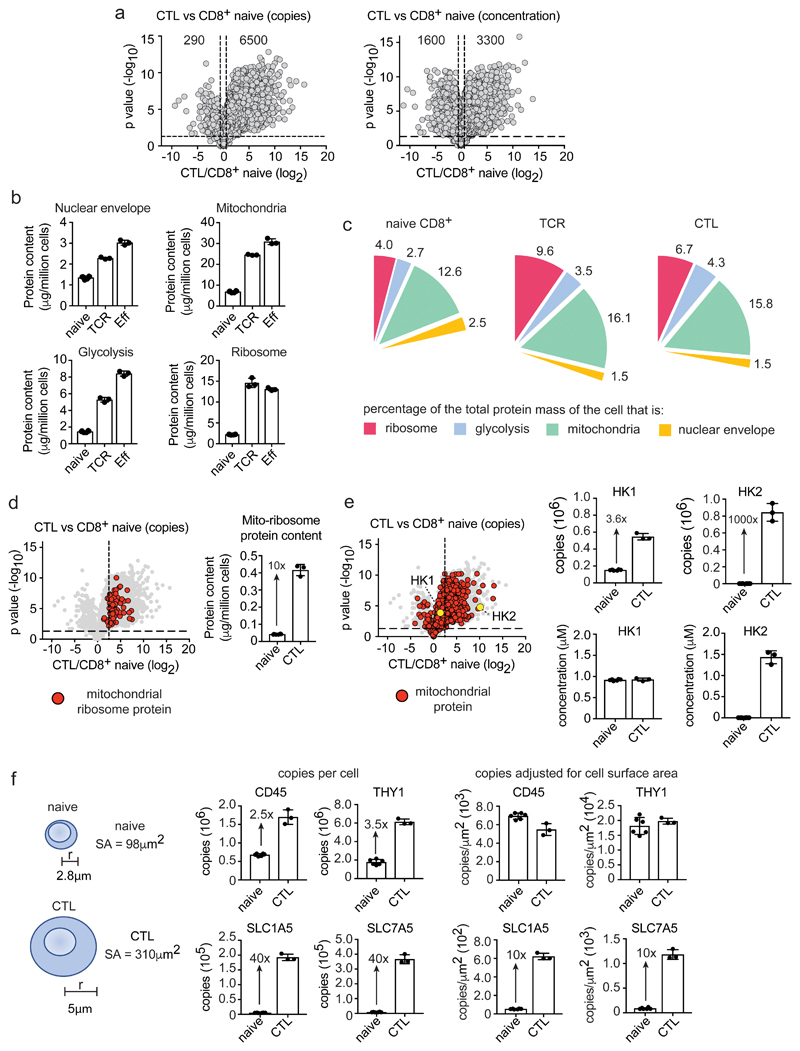
Figure 3. Scaling versus selective enrichment of proteins and processes during T cell differentiation.
(a) Comparing protein copy number and concentration. Volcano plots show the ratio for proteins in CTLs versus naïve CD8+ T cells (CTL/naïve), using copies/cell or cellular protein concentration (μM). Horizontal dashed line indicates a P value = 0.05, vertical dashed lines indicate a fold change = 1.5 (b) Protein content of ribosomes (KEGG 03010), mitochondria (GO:0005739), nuclear envelope (GO:0005635) and the glycolytic pathway. (c) Protein content of cellular compartments relative to the total cellular protein mass (%). (d) Expression profile and protein content of mitochondrial ribosomal proteins in naïve CD8+ T cells and CTLs. The vertical dashed line on the volcano plot is the mean fold change (copy number CTL/naïve) of all proteins. (e) The expression profile of mitochondrial proteins in CTLs versus naïve CD8+ T cells (copy number CTL/naïve). Mitochondrial proteins are highlighted with red circles. Hexokinase 1 (HK1) and hexokinase 2 (HK2) are highlighted with yellow circles. Vertical dashed line is the mean fold change for all proteins. Copy number and concentration of HK1 and HK2 is also provided. (f) Protein copy numbers relative to cell surface area. The surface area of naïve and effector CD8+ T cells was estimated using the formula 4πr2, assuming the radius of a naïve cell to be 2.8 μm and a CTL to be 5 μm42, 43. Data shows protein copy numbers per cell and protein copy numbers adjusted for cell surface area (copies/μm2). For a-f, n = 6 biologically independent samples for CD8+ naïve cells and 3 biologically independent samples for each of the other T cell populations. Histogram bars represent the mean +/- SD. For a, d and e, P values calculated using a two-tailed t-test with unequal variance.

