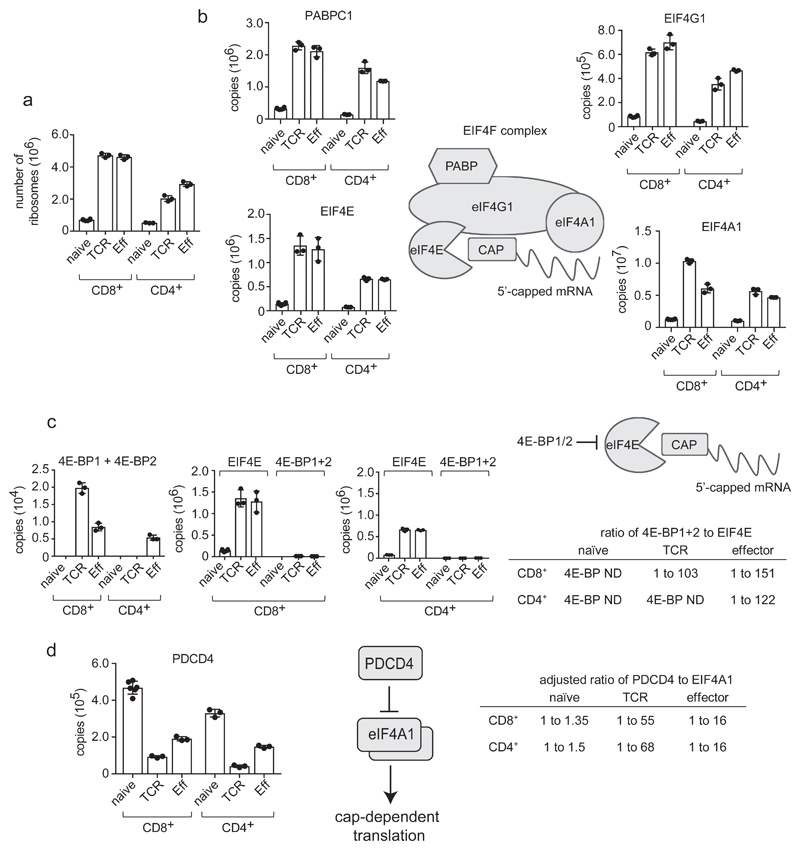
Figure 5. Regulation of mRNA translation in T cells.
(a) Number of ribosomes in naive, TCR activated and effector CD4+ and CD8+ T cell populations. Number of ribosomes was estimated by calculating the mean number of ribosomal subunits within each cell using the KEGG annotation: 03010. (b) Expression profile of key components of the Eukaryotic Initiation Factor 4F (EIF4F) mRNA translation initiation complex during differentiation. EIF4F consists of Eukaryotic Translation Initiation Factor 4 Gamma 1 (EIF4G1), Eukaryotic Translation Initiation Factor 4A1 (EIF4A1), Eukaryotic Translation Initiation Factor 4E (EIF4E) and Poly(A) Binding Protein Cytoplasmic 1 (PABPC1). Data is presented as protein copies per cell in naïve, TCR activated and effector CD8+ and CD4+ T cell populations. (c) Stoichiometry of eukaryotic initiation factor 4E-binding proteins 1 and 2 (4E-BP1+2) to EIF4E in T cell populations. Copy numbers for 4E-BP1 and 2 were combined. 4E-BP1+2 are also plotted adjacent to copy numbers for EIF4E to assess whether inhibitor levels are adequate to block translation initiation, and the ratio of 4E-BP1+2 to EIF4E is presented (ND = not detected). (d) Stoichiometry of Programmed Cell Death 4 (PDCD4) and EIF4A1 during T cell differentiation. The ratio of PDCD4 to EIF4A1 in naïve, TCR triggered and effector CD4+ and CD8+ T cells is shown adjusted to account for 1 molecule of PDCD4 binding 2 molecules of EIF4A1 to inhibit CAP-dependent translation26. For a-d, n = 6 biologically independent samples for CD8+ naïve cells and 3 biologically independent samples for each of the other T cell populations. Histogram bars represent the mean +/- SD.

