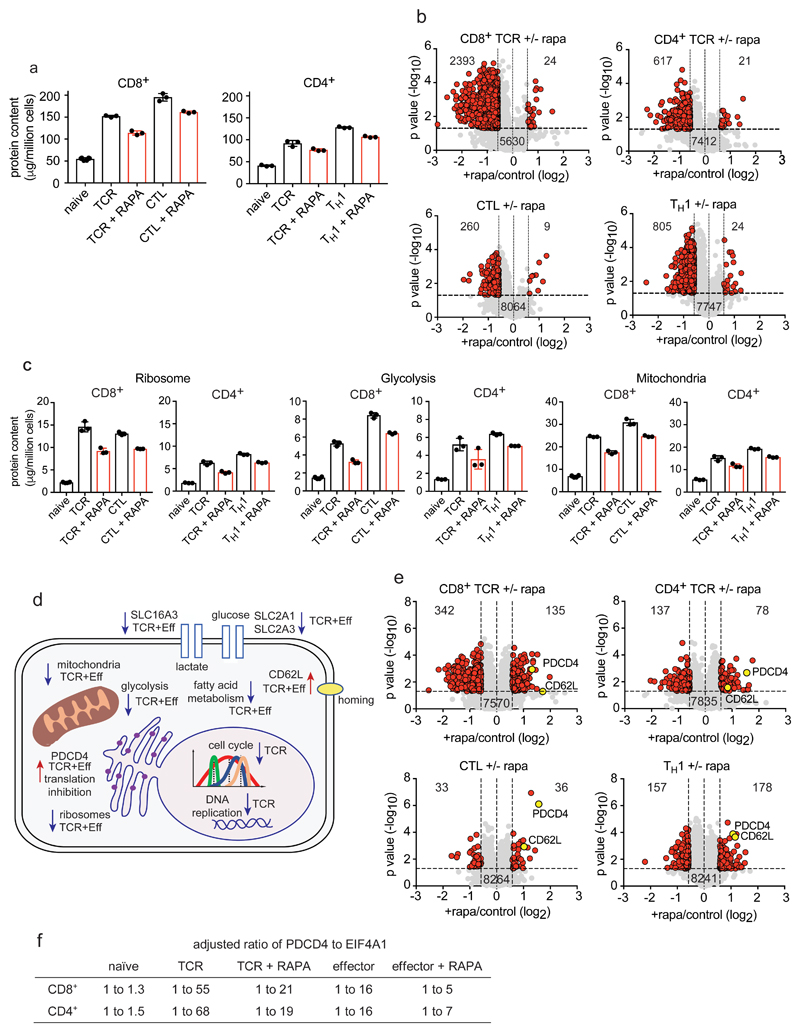
Figure 7. The impact of mTORC1 inhibition on CD4+ and CD8+ T cell proteomes.
(a) Protein content of T cells in response to mTORC1 inhibition. Naïve CD4+ and CD8+ T cells were TCR triggered for 24 h +/- rapamycin while effector CD4+ and CD8+ cells were incubated for 24 h +/- rapamycin. (b) Volcano plots show the protein ratios for rapamycin treated cells versus control (+rapamycin/control copy numbers). Proteins highlighted in red have a P value <0.05 and a fold change >1.5 while proteins highlighted in grey did not change significantly. (c) The impact of rapamycin on the glycolytic pathway, ribosomes and mitochondria in CD4+ and CD8+ cells. (d) Summary of cellular processes impacted by mTORC1 inhibition. Arrows pointing downwards indicate decreased abundance while arrows pointing upwards indicate increased abundance. Proteins/processes changing in TCR stimulated cells only are labelled “TCR” while those changing in TCR and effector populations are labelled “TCR+Eff”. (e) The impact of inhibiting mTORC1 on protein concentration. Volcano plots were generated as described above. (f) The ratio of PDCD4 to EIF4A1. 1 molecule of PDCD4 binds 2 molecules of EIF4A1 and the ratios have been adjusted to account for this binding stoichiometry. For a-f, n = 6 biologically independent samples for CD8+ naïve cells and 3 biologically independent samples for each of the other T cell populations. Histogram bars represent the mean +/- SD. For b and e, P values were calculated using a two-tailed t-test with unequal variance.

