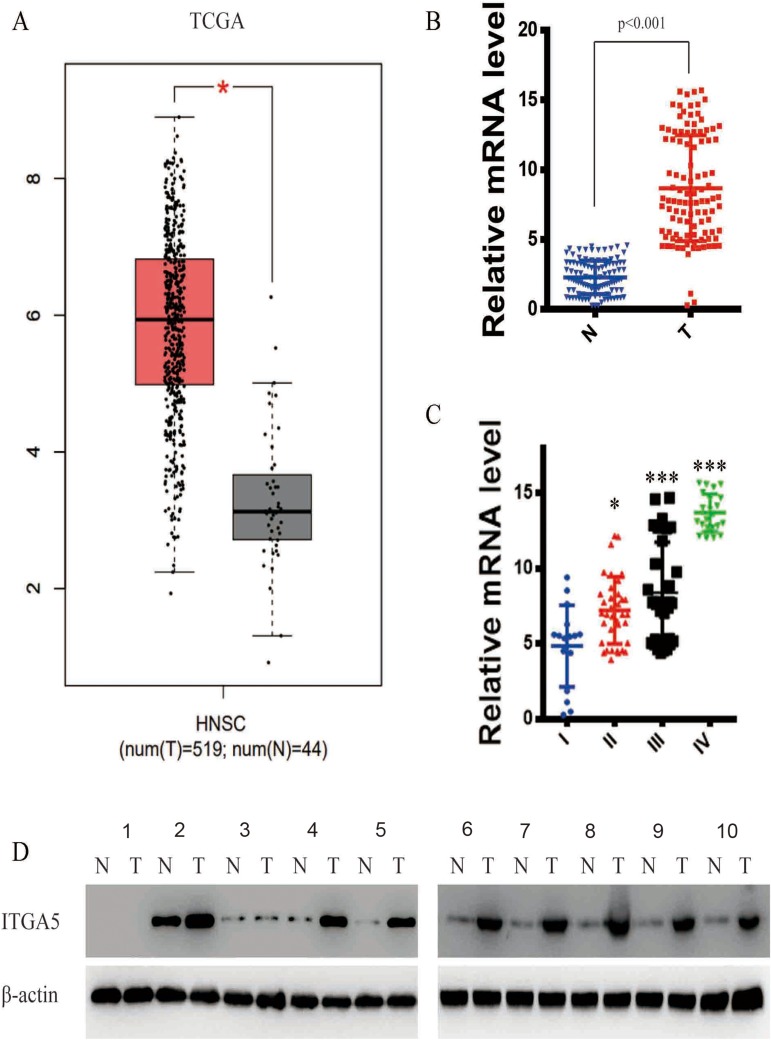
Figure 1.
ITGA5 was upregulated in OSCC. (A) The expression difference of ITGA5 in TCGA database. (B) The relative mRNA level of ITGA5 of our own database. (C) The relative mRNA level of ITGA5 in different stages of tumour. (D) Western blot of ITGA5 in 12 paired OSCC and normal tissue. All the samples were taken from tongue. Stage I: sample 1.2. Stage II: sample 3.4. Stage III: sample 5.6.7. Stage IV: sample 8.9.10.*p<0.05, ***p<0.001.

