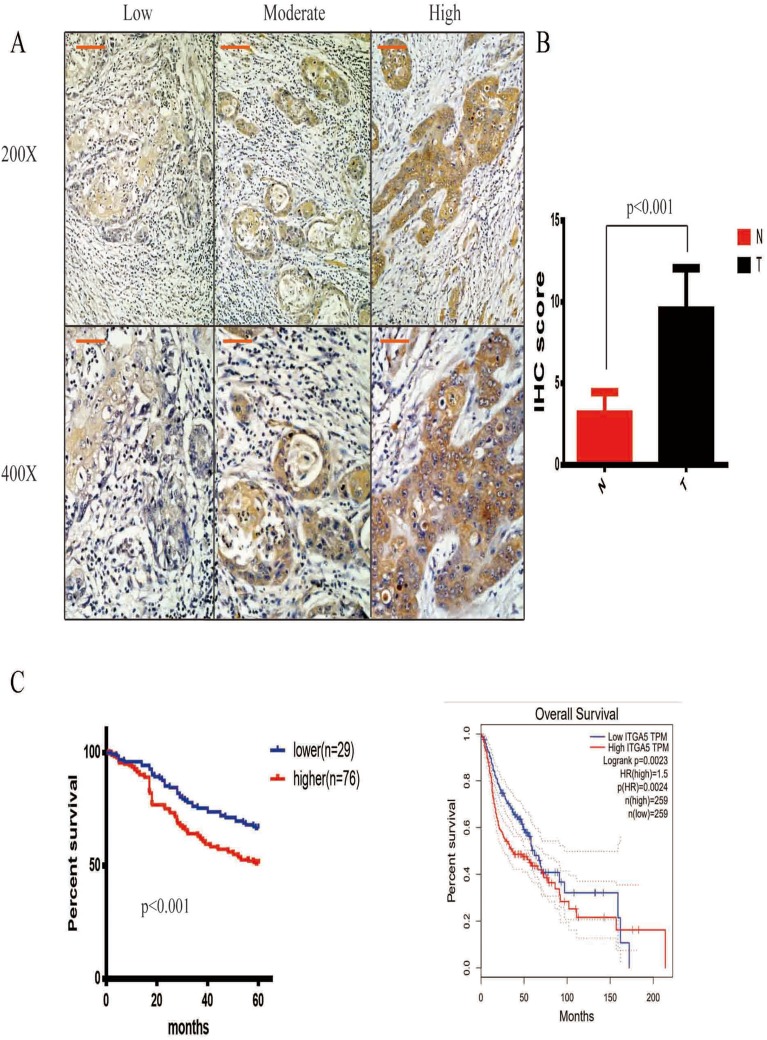
Figure 2.
ITGA5 was negatively correlated with prognosis. (A) The representative image of IHC, 200× scale 50μm, 400× scale 200μm. (B) The statistical analysis of IHC score in paired OSCC and normal tissue, all the tissues were taken from tongue. (C) Left, the survive curve of patients of own database, all the tissues were taken from tongue. Right, the survive curve of patients of TCGA database.

