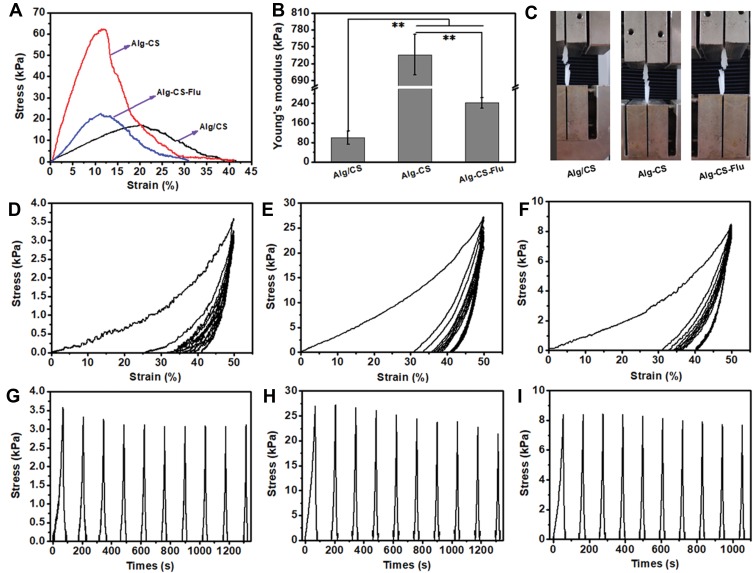
Figure 6.
(A) Representative stress–strain curves; (B) Young’s modulus; (C) photographs of fracture of scaffold strips; cyclic tensile response curves at 50% deformation of (D) and (G), Alg/CS scaffold, (E) and (H) Alg-CS scaffold, and (F) and (I) Alg-CS-Flu scaffold in dry states. **indicates significant difference at p<0.01 level.

