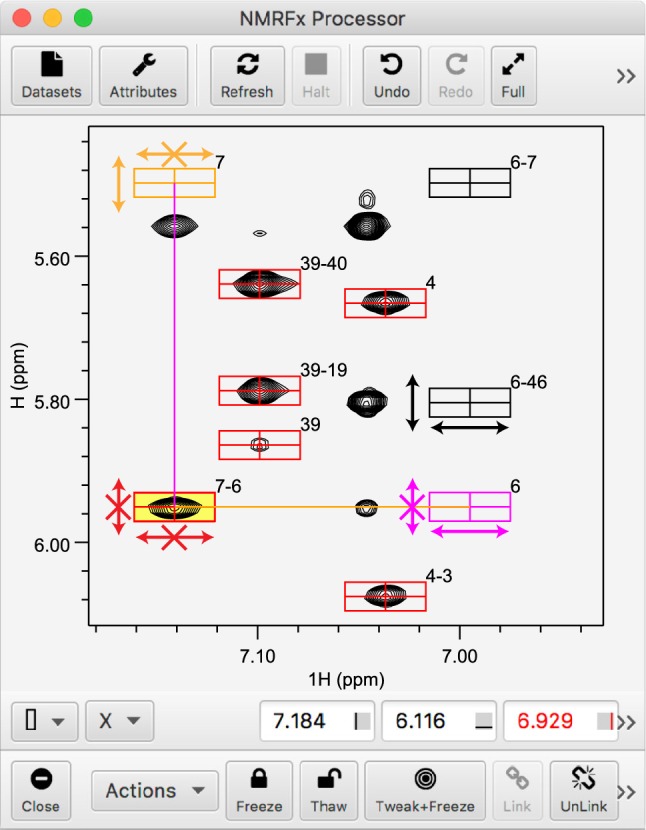
Fig. 1.

Screenshot of the NMRFx Analyst GUI with a network assignment procedure in progress. The rectangular peak-boxes illustrate predicted peaks, label numbers indicate the residues involved, and arrows are used to show whether peak-boxes can be moved in each dimension (no X) or are frozen in that dimension (with X). Peak-boxes in black (with residue numbers 6–46, and 6–7) are initially in the predicted positions and can be freely adjusted, as shown by black arrows for peak-box 6–46. Peak-box 7–6 (red) has been selected (yellow background) and then frozen and can no longer be adjusted in either dimension. As a consequence of freezing this peak-box, peak-box 7 (orange) is now frozen in the horizontal position yet adjustable in the vertical so it could be slid down to align with the peak below. The opposite is true for peak-box 6 (magenta) which could be slid left to align with a peak. Other red peak-boxes have already been positioned and frozen. Controls at bottom allow for freezing and thawing peaks. The Tweak + Freeze button will automatically center a peak-box on an overlapped peak before freezing
