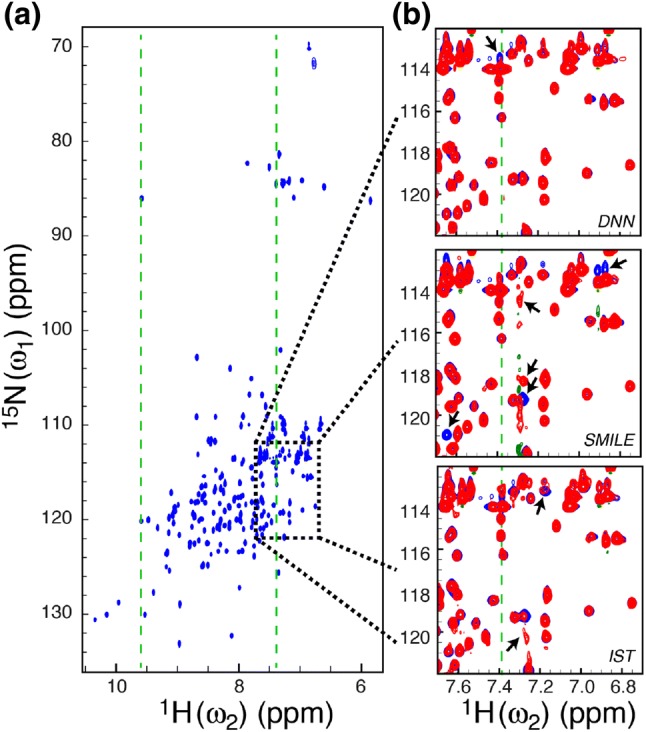
Fig. 2.

a The fully sampled 15N–1H HSQC spectrum of T4L L99A used to evaluate the performance of the DNN algorithm for reconstruction of sparsely sampled one-dimensional spectra. The peaks between 82 and 88 ppm originate from arginine side-chain 15Nε–1Hε. The green vertical dashed lines show where the one-dimensional spectra in Fig. 3 are extracted from. b Overlays created for a part of the spectrum (black dotted box in a) of the fully sampled spectrum (blue) and the three reconstructed spectra (red), DNN, SMILE and IST. Reconstructed spectra were generated from a sparsely sampled spectrum based on a Poisson-gap sampling schedule with 12.5% of the points sampled (32 out of 256; Table S1). Main differences between the fully sampled spectrum and the reconstructed spectra are indicated with black arrows
