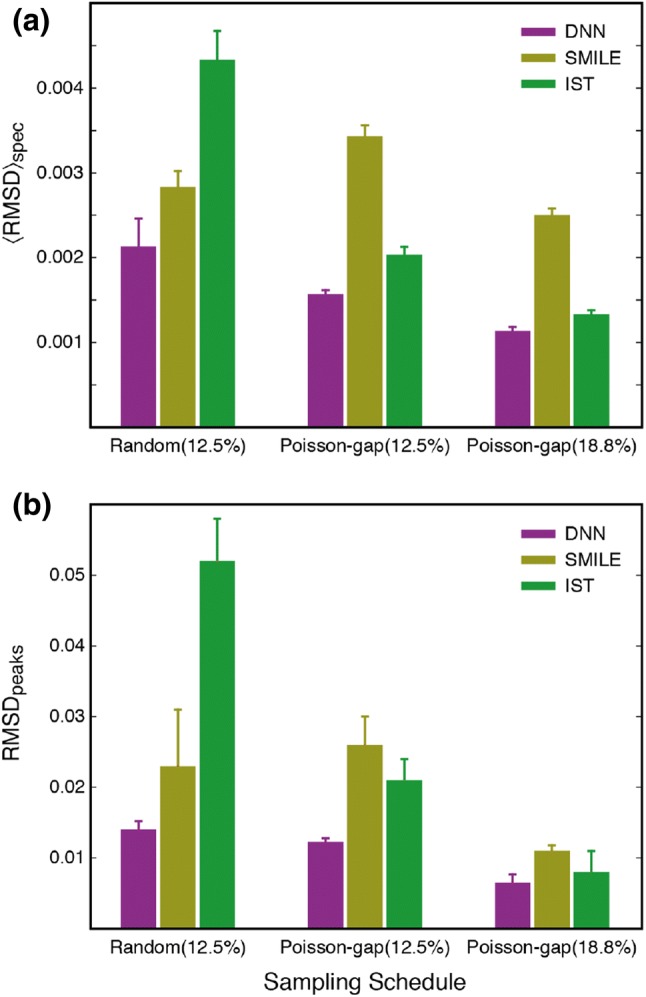
Fig. 5.

Summary of reconstruction of sparsely sampled one-dimensional NMR spectra. a The average normalised RMSD between the fully sampled frequency-domain spectrum and the reconstructed spectrum calculated for 1H frequency between 6.5 and 9.6 ppm. b The RMSD between normalised peak-intensities obtained from the fully sampled spectrum and the reconstructed spectra. The vertical error-bar shows the standard-deviation for three reconstructions
