
Figure 2.
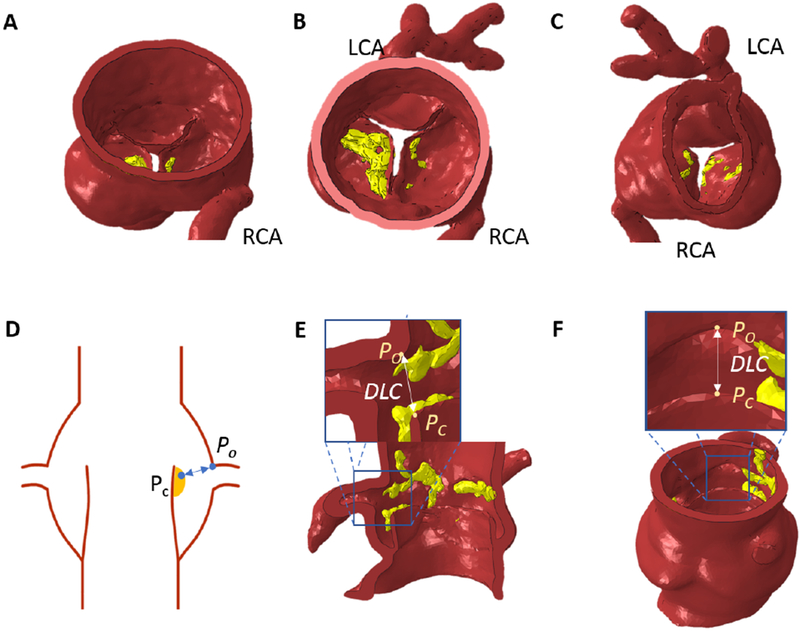
Example of patient specific 3D modeled aortic root with left coronary artery (LCA), right coronary artery (RCA), and yellow calcific nodules; (A) side view (B) aortic view (C) ventricular view; The measured distance from a point on cusp/or cusp calcium (Pc) to a point on the upper ostium of the coronary artery (Po) following a transcatheter valve replacement (DLC) from (D) Idealized root schematic from the side view; example finite element simulated post-TAVR aortic root with DLC from a top view (E) and side view (F)