Fig. 3.
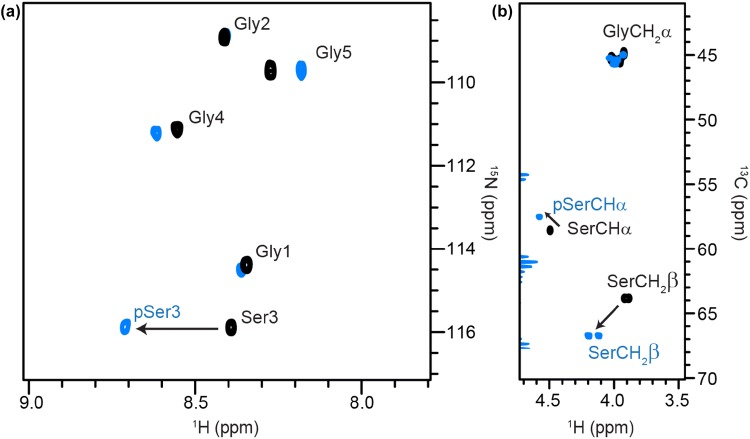
Serine phosphorylation. a Superposition of 1H–15N HSQC NMR spectra of random coil peptides containing serine (black contours) and phosphoserine (blue contours) as residue ‘X’. The arrow shows the characteristic ~ 0.3 ppm downfield shift of HN upon phosphorylation. b1H–13C HSQC NMR spectra with shifts of Hα/Cα and Hβ/Cβ marked with arrows

