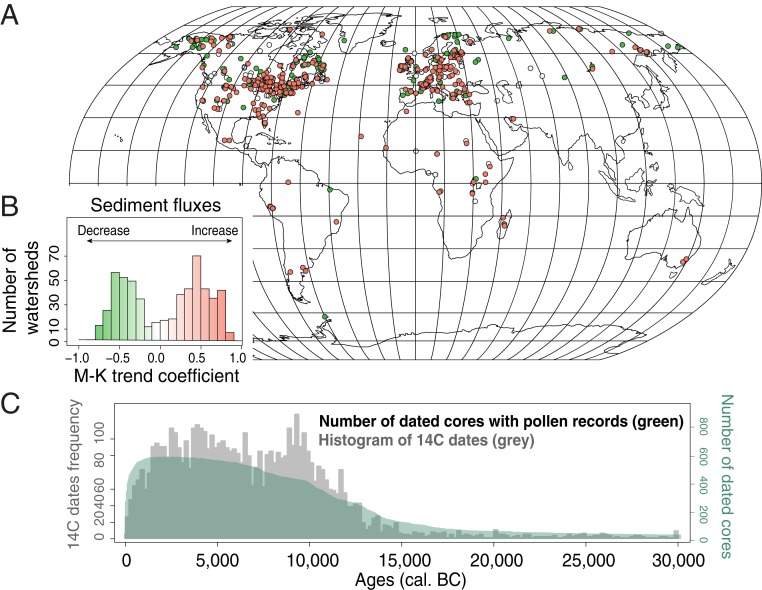
Fig. 1.
(A) Location of the 632 study sites and changes in lake sediment rates over the last 10,000 y. Increases in lake sediment rates (red dots) were observed in 35.1% of the watersheds according to M-K τ coefficients; the rest of the sites show a decrease (green dots) or steady (white dots) rates. (B) Distribution of M-K trend τ coefficients. (C) Number of dated cores containing a pollen record and distribution of 14C dates (intervals = 12,000 y) used to calculate SARs.

