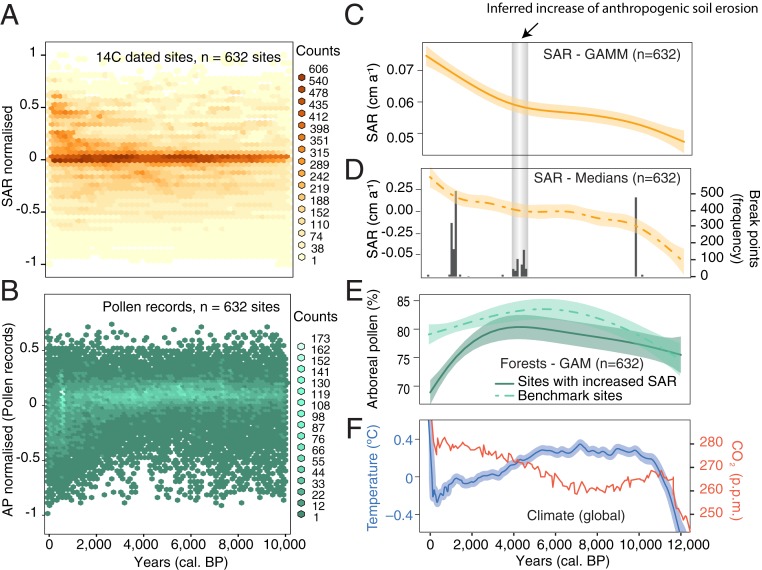
Fig. 2.
Trends in lake SARs (proxy of erosion), land cover as well as climate change during the Holocene. (A and B) Density plots of the anomalies in SARs and AP percentages (43,669 pollen samples), respectively, for 632 14C-dated sites (3,980 calibrated 14C ages). Global trends for SARs are shown in 632 lakes based on an GAM, with 95% confidence intervals on the predicted means (C), as SARs medians trends calculated every 50 y (n = 632 sites) and point breaks detected on the SAR medians curve global trend based on a bootstrap distribution (D). (E) Changes in land cover are shown as trends AP percentage for the subset of sites (n = 116) recording an increase in SARs over time (solid green line), and for a subset of sites (n = 287) recording no significant changes in SARs over time, denoted here as benchmark sites (dashed green line). (F) From ref. 15: trends in global temperature anomalies (relative to the average over the period 1961–1990 in blue) and atmospheric CO2 (red) from the GRIP ice core59.

