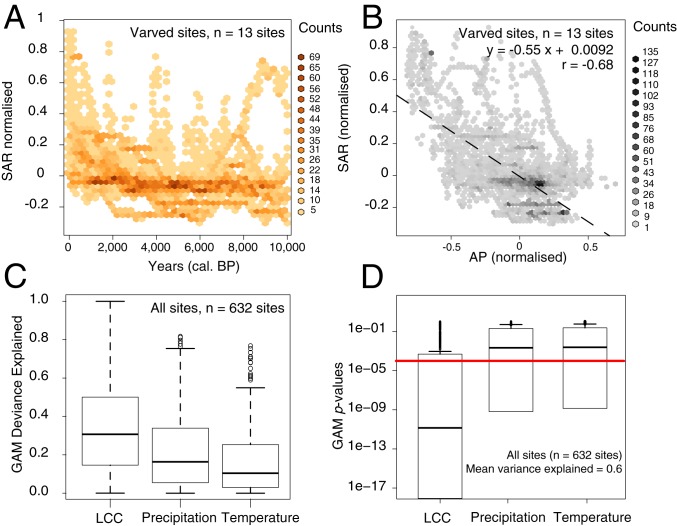
Fig. 3.
Holocene-scale trends in 12 annually resolved varved sites. (A) Density plot normalized SARs trends for 12 varved lakes. (B) Negative correlation between SARs and AP fraction of the varved sites. (C) Deviance explained in the SAR trends by changes in land cover, precipitation, and temperatures in the GAM models run for each of the 632 14C-dated sites. (D) GAMs were run 632 times, and P value results inform the contribution of LCC, precipitation, and air temperature to SARs.

