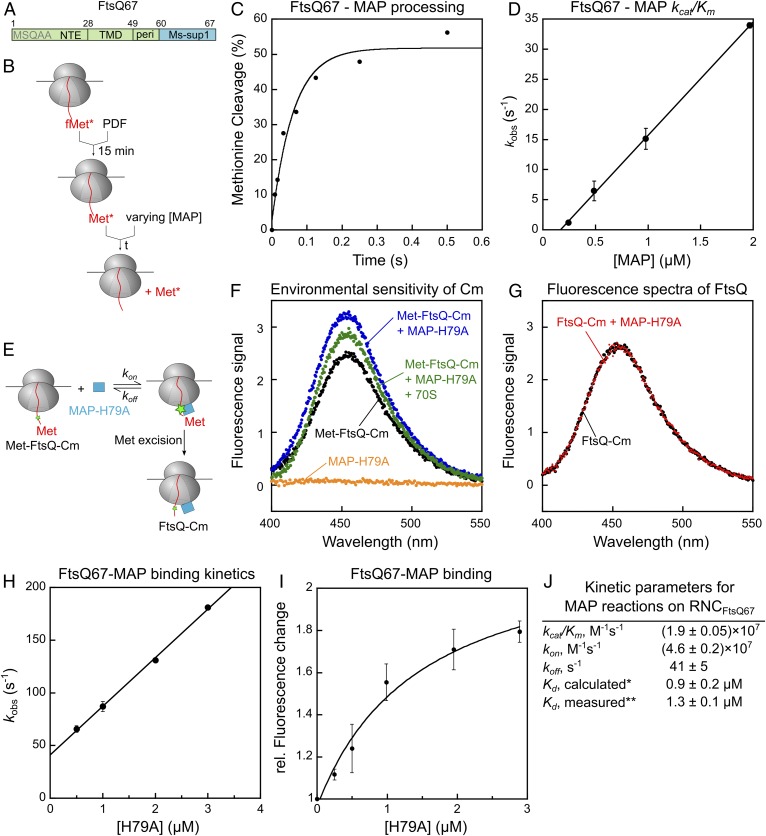
Fig. 1.
MAP-mediated methionine excision of nascent chains on the ribosome is diffusion-limited. (A) Scheme of the model substrate FtsQ67 for generation of RNC, which contains the N-terminal extension (NTE), transmembrane domain (TMD), and part of the periplasmic region (peri) followed by the Ms-sup1 translation stall sequence. The N-terminal sequence is indicated. (B) Scheme of the methionine cleavage assay to measure the rate constant of the MAP reaction. Purified RNC with a single 35S-labeled N-terminal methionine was preincubated with PDF for 15 min, before initiation of reaction by addition of MAP. Reactions contained 10 nM RNC, 50 nM PDF, and varying concentrations of MAP. (C) A representative time trace for cleavage of 10 nM RNCMet-FtsQ67 by 1 μM MAP. Single exponential fit of the data (equation 1 in SI Appendix, Methods) gave a kobs value of 16.4 s−1. (D) The observed rate constants for methionine cleavage of RNCMet-FtsQ67 were plotted as a function of effective MAP concentration. The line is a linear fit of the data, and the obtained kcat/Km value is summarized in J. (E) Scheme of the fluorescence-based assay to measure the binding between RNCMet-FtsQ67Cm and MAP. The FtsQ67 nascent chain was labeled with coumarin (Cm) at the fifth residue. (F) Fluorescence emission spectra to demonstrate the enhancement of Cm fluorescence upon binding of RNCMet-FtsQ67Cm to MAP-H79A. Where indicated, reactions contained 8 nM deformylated RNCMet-FtsQ67Cm, 0.5 μM MAP-H79A, and 1.4 μM 70S ribosome. (G) MAP-H79A does not affect the fluorescence emission spectra of RNCFtsQ67Cm after methionine excision. RNCMet-FtsQ67Cm was pretreated with 20 nM wild-type MAP to yield RNCFtsQ67Cm, and fluorescence emission spectra were recorded before and after the addition of 0.5 µM MAP-H79A. (H) Observed rate constants (kobs) of RNC-MAP association, measured using the fluorescence assay in E, was plotted as a function of MAP-H79A concentration. The reactions contained 8 nM RNCMet-FtsQCm and indicated concentrations of MAP-H79A. The line is a linear fit of the data to equation 6 in SI Appendix, Supplementary Methods, and the obtained kon and koff values are summarized in J. (I) Equilibrium titration to measure the binding affinity of RNCMet-FtsQCm for MAP-H79A. The data were fit to equation 5 in SI Appendix, Supplementary Methods, and the obtained Kd value is summarized in J. (J) Summary of the kinetic parameters obtained from the measurements in D, H, and I. *Calculated from Kd = koff/kon. **Kd measured from the equilibrium titration in I. All values are reported as mean ± SD with n = 2.

