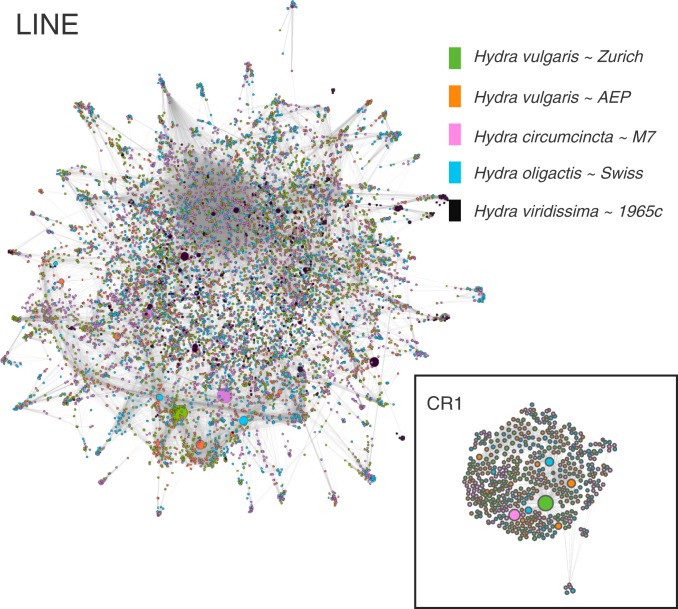
Fig. 2.
Expansion of a specific CR1 retrotransposon family in the brown hydra lineage. Sequence similarity graph of LINE families for 5 Hydra species. The sizes of the circles correspond to the number of elements within each family, with species colored according to the key. Expansion is restricted to only one part of the graph (larger circles), stemming mostly from a single retrotransposon family (CR1, expanded panel).

