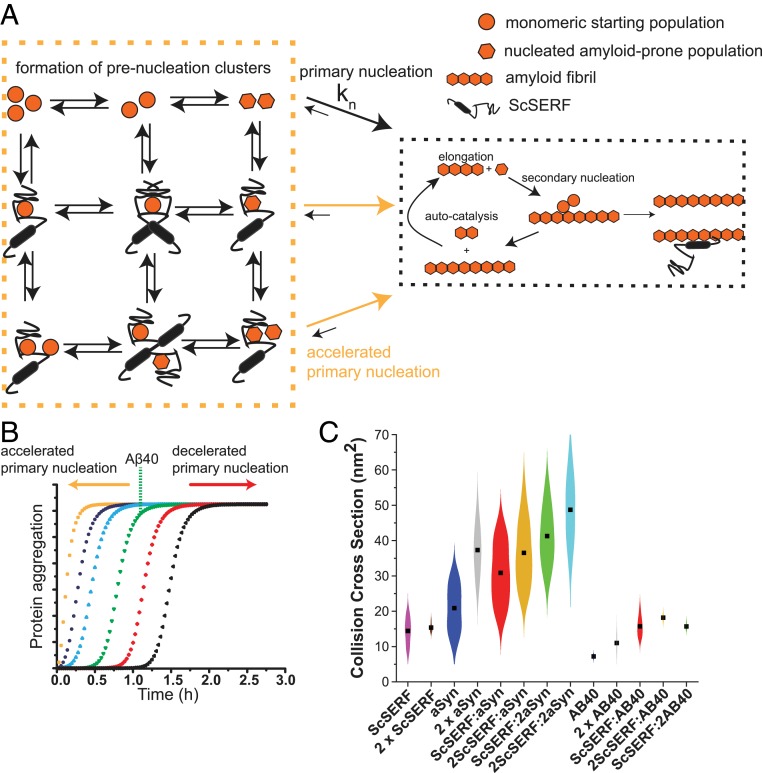
Fig. 5.
Schematic representation of ScSERF's effect on amyloid formation. (A) The Aβ40/α-synuclein amyloid formation pathway consists of primary nucleation, elongation, and secondary nucleation. During primary nucleation, Aβ40/α-synuclein forms its amyloid-prone conformation (hexagons) from the starting pool of disordered monomeric Aβ40 (circles). ScSERF engages in 3 different complexes with Aβ40 (1:1, 1:2, and 2:1) and in 4 different complexes with α-synuclein (1:1, 1:2, 2:1, and 2:2). In the presence of ScSERF, the primary nucleation step is accelerated by these binding events. (B) Simulation of 25 μM Aβ40 amyloid kinetics based on the published model; simulation with the published rate constants is shown in green (primary nucleation rate = 2 × 10⁻⁶, elongation rate = 3 × 10⁵, and secondary nucleation rate = 3 × 10³) (5). Increasing the primary nucleation rate (blue, purple, and orange plots) or decreasing it (red and black plots) changes the lag time, which matches our observed data in the presence of ScSERF. (C) Violin plots of the CCSs of the different ScSERF containing complexes observed in the native MS experiments. Black squares indicate the mean CCS of each complex. The kernel density distributions around the mean are a probability estimation of the number of complexes occupying that CCS bin based on the input set of experimental data.

