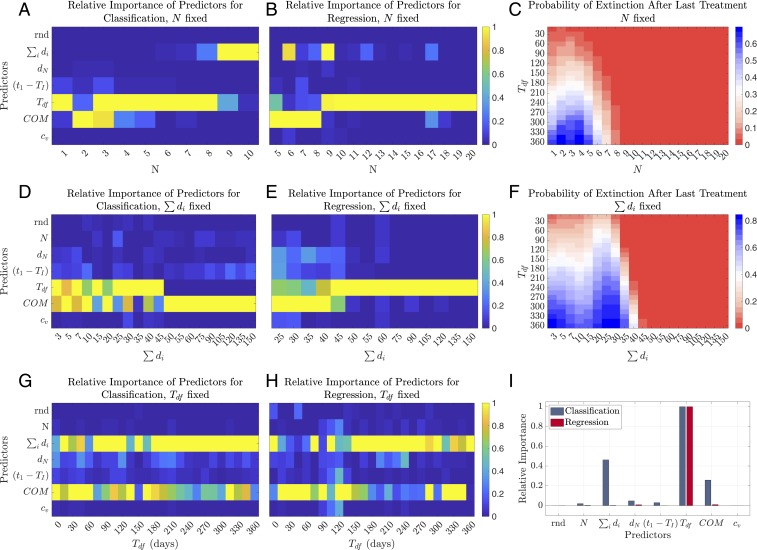
Fig. 4.
Predictor importance analysis and extinction probabilities of the resistant opportunistic pathogen population. Conditional predictor importance values are calculated over samples and 200 trees and normalized between 0 and 1. Extinction probabilities are calculated using 600,000 randomly subsampled realizations, 1,200 realizations per per value. (A and B) Normalized conditional predictor importance values for (A) classification and (B) regression, for different values of number of treatment courses () varying from 1 to 20. (C) Extinction probability of the resistant pathogen population given the number of treatment courses () and the duration of drug-free period after last treatment (). (D and E) Normalized conditional predictor importance values for (D) classification and (E) regression, for different values of total duration of all treatments () varying from 3 to 150 d. (F) Extinction probability of the resistant pathogen population given the total duration of all treatments () and the duration of drug-free period after last treatment (). (G and H) Normalized conditional predictor importance values for (G) classification and (H) regression, for different values of the duration of drug-free period after last treatment () varying from 0 to 360 d. (I) Normalized conditional predictor importance values for classification and regression when all predictors are randomized.

