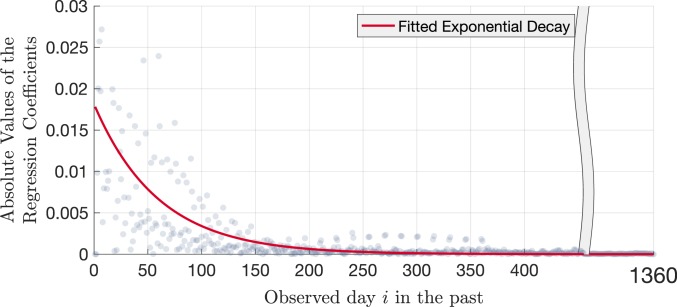
Fig. 5.
Absolute values of the linear regression coefficients given the day index , calculated using 600,000 randomly subsampled realizations, 1,200 realizations per per value. The red curve represents the exponential decay function in the form of , fitted to the magnitude of the linear regression coefficients to demonstrate the exponential decay of contribution of information as one moves farther back in the treatment history of the patient.

