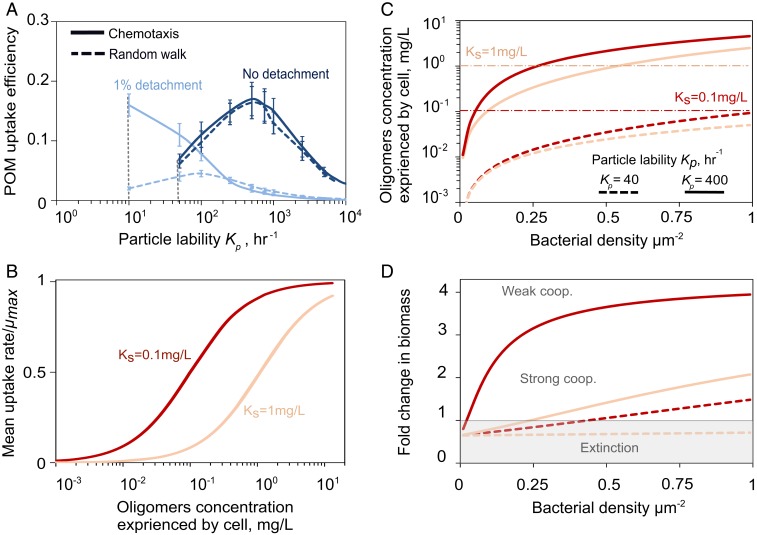
Fig. 3.
Bacterial aggregation enhances oligosaccharide uptake rate. (A) Effects of individual cell behavior on POM uptake efficiency. Solid lines show the simulation results with chemotactic behavior, and simulations with only random walk are shown with dashed lines. Data are shown for 10 h of simulation with an initial cell number of 107 cells/mL and a particle radius of 200 µm. Vertical dashed lines indicate that no bacterial growth is sustained below the indicated Kp values. (B) Mean oligosaccharides uptake rate as a function of oligosaccharide concentration modeled by Monod uptake kinetics. Two scenarios are depicted: high (Ks = 0.1 mg/L) and low (Ks = 1 mg/L) affinity. (C) The effects of bacterial cell density on the oligosaccharide release by hydrolysis, for different values of Ks (red vs. peach lines) and Kp (dashed vs. solid lines). Simulations are performed for a particle with constant radius of 200 µm and initial cell density of 0.3 cell/µm−2. (D) Fold change in biomass as a function of initial bacterial density is shown for simulations of bacterial colonization on a single particle after 20 h. For low affinities (high Ks, peach lines) and high recalcitrance (low Kp, dashed lines) strong cooperative (strong coop.), effects emerge and a minimum cell density threshold is required for growth and degradation.

