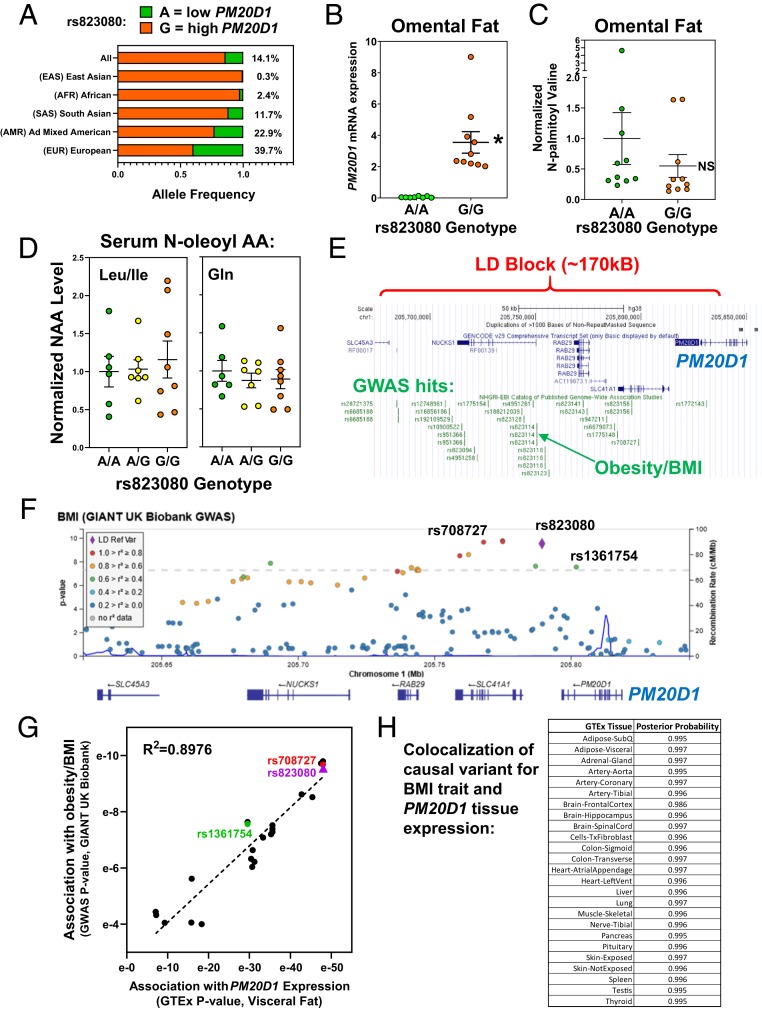
Fig. 7.
Potential phenotypes of human PM20D1 genetic variation. (A) Population-specific allele frequencies were calculated for the PM20D1 eSNP rs823080 using LDhap. (B) PM20D1 mRNA expression was quantified by qPCR in 20 human omental fat samples, divided by rs823080 genotype with n = 10 A/A (green) and n = 10 G/G (orange). Mean and SEM, *P < 0.01 by student’s t-test. (C) The metabolite N-palmitoyl-valine was measured in these same 20 omental fat samples. Mean and SEM, *P < 0.01. (D) The indicated NAAs were measured in human serum samples from 21 individuals differing by rs823080 genotype, n = 6 A/A (green), n = 7 A/G (yellow), and n = 8 G/G (orange). Mean and SEM. (E) The linkage disequilibrium (LD) block containing the PM20D1 expression SNPs was visualized on the UCSC genome browser, along with a catalog of lead SNPs in published GWAS studies (green). (F) Locus zoom plot showing association of BMI with SNPs in the PM20D1 locus, colored by their linkage to the eSNP rs823080 (purple). (G) Scatterplot correlating the significance of each SNP’s association with BMI (via GWAS query, y axis) versus PM20D1 expression (via GTEx query, x axis). (H) Colocalization analysis was performed to calculate the likelihood that the same causal SNP drives both PM20D1 expression in various tissue and the BMI GWAS signal in this locus.

