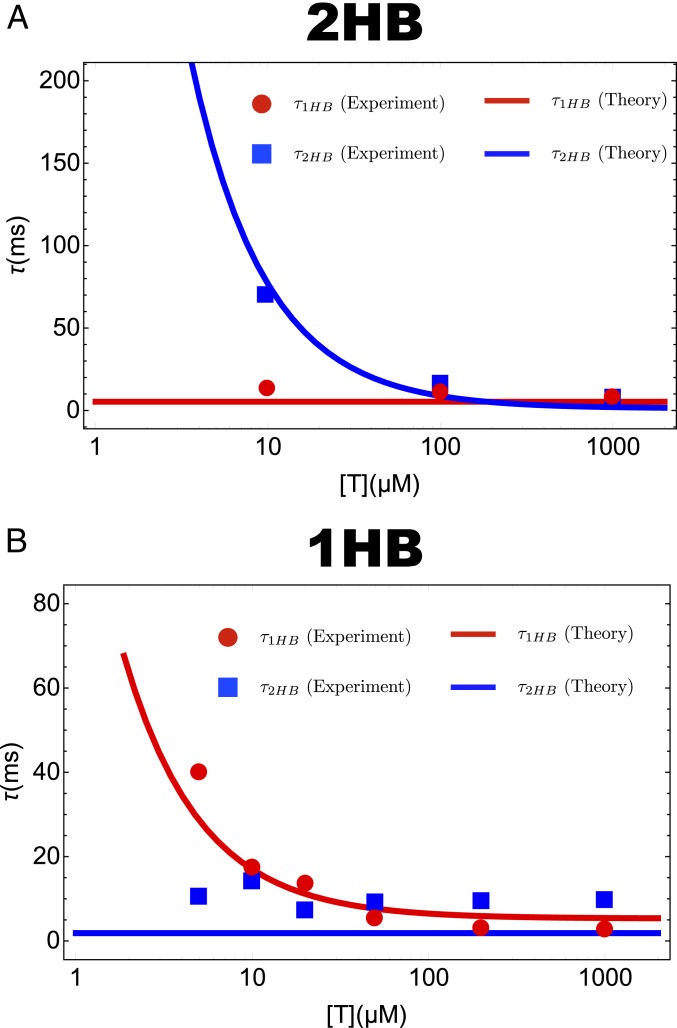
Fig. 3.
Mean dwell time for the 2HB state () and the 1HB state () as a function of ATP concentration at . (A) The 2HB model (Fig. 1C). (B) The 1HB model (Fig. 1D). Red circles and blue squares are taken from the experiments by Mickolajczyk et al. (31) (A) and Isojima et al. (14) (B). Lines are the theoretical predictions for the dwell times for the 1HB state and 2HB states. Note that in A is [T] independent whereas in B does not depend on [T].

