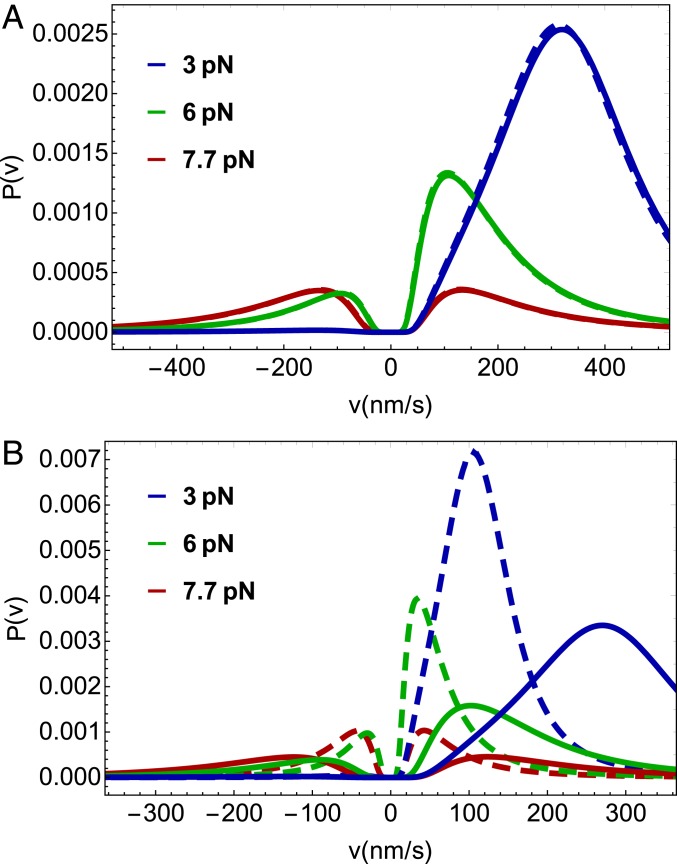
Fig. 4.
Velocity distributions for predicted by our theory for different loads and ATP concentrations. Solid lines are for the 2HB model (Fig. 1C) and dashed lines are for the 1HB model (Fig. 1D). Colors represent different loads applied to kinesin. (A) Velocity distribution at 1 mM ATP concentration. (B) Velocity distribution for 10 M ATP concentration.

