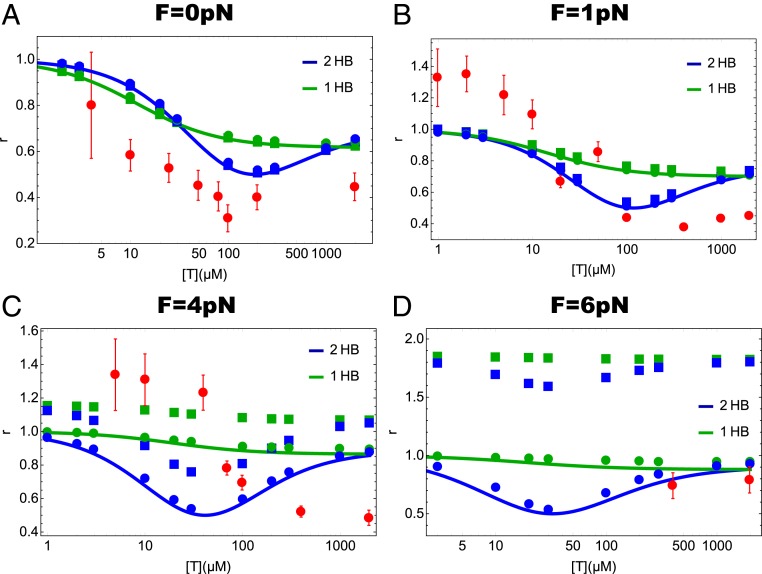
Fig. 5.
Theoretical prediction of the ATP concentration dependence of the 3 randomness parameters, , , and at different external loads for the 2HB and 1HB models (Fig. 1 C and D, respectively). Solid squares, solid circles, and lines denote , , and , respectively. Red circles with error bar in A are the experimentally measured randomness parameter at in ref. 48. Red circles with error bar in B–D are the randomness parameters measured in ref. 11: (B) for 1.05 pN, (C) for 3.59 pN, and (D) for 5.69 pN. As explained in Discussion, the values of the randomness parameters in our schemes are always equal or greater than 0.5.

