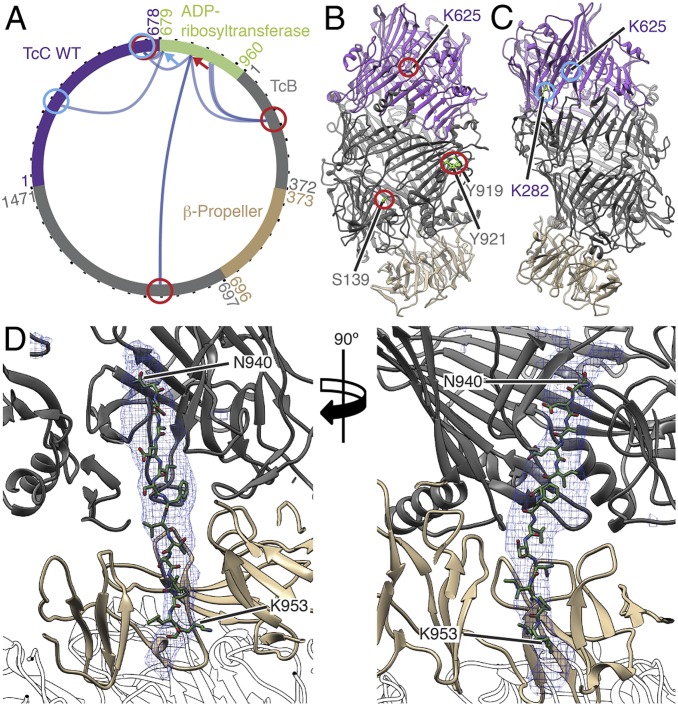
Fig. 5.
XL-MS of the toxic enzyme inside the TcB-TcC WT cocoon and atomic model of the ADP-ribosyltransferase in the narrow passage of TcB. (A) Visualization of cross-links (dark-blue curves) between the TcB-TcC cocoon (gray and violet; β-propeller in sand) and the toxic enzyme (green). Two individual positions (K785 and K690 of TcC) and their cross-links to the TcB-TcC cocoon are indicated with red and blue arrows and circles, respectively. All cross-links with a score of ≥50 are shown. The plot was created using xVis (48). A complete list of all cross-links is shown in SI Appendix, Table S2. (B and C) The TcB-TcC cocoon (PDB ID code 4O9X) with all amino acids that undergo cross-links with K785 indicated and highlighted with red circles (B) and cross-links with K690 indicated and highlighted with blue circles (C). The cocoon is colored gray and violet, and the β-propeller (residues 376 to 691 of TcB) is in sand. (D) Atomic model of the ADP-ribosyltransferase (N940 to K953 of TcC) in the narrow passage of TcB. The density map corresponding to the ADP-ribosyltransferase is shown as a blue mesh. TcA is shown transparent.

