Fig. 1.
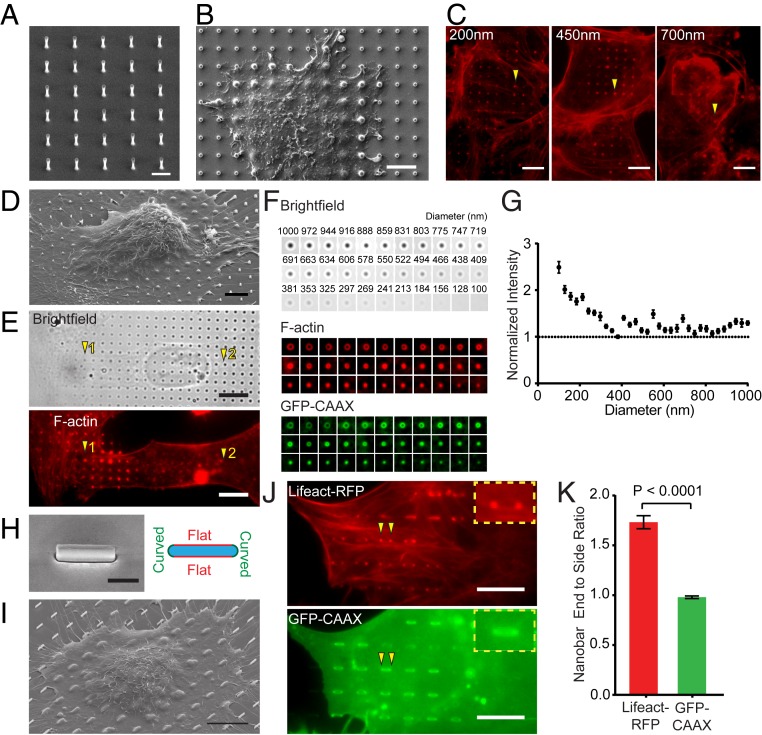
Vertical nanostructure-induced actin polymerization is curvature dependent. (A) An SEM image of a vertical SiO2 nanopillar array with 2-μm height, 3-μm center-to-center distance, and 400-nm diameter. (B) An SEM image shows the deformation of the plasma membrane by nanopillars. (C) Phalloidin staining shows F-actin accumulation around vertical nanopillars with 200-, 450-, and 700-nm diameters. The height and center-to-center distance of the nanopillars are 2 μm and 4 μm, respectively. (D) An SEM image of a U2OS cell cultured on a gradient nanopillar array covering a range of nanopillar diameters. (E) On a gradient nanopillar array, phalloidin staining shows stronger F-actin accumulation on small-diameter nanopillars than large ones (1 versus 2) in the same cell. (F) The average images of brightfield, F-actin, and GFP-CAAX on nanopillars with 33 different diameters, from the largest to the smallest. n = 235 to 452 (see SI Appendix, Table S1 for detailed statistics). (G) F-actin signal normalized by the GFP-CAAX signal increased when the nanopillar diameter decreases below 400 nm. (H, Left) An SEM image of a nanobar with 200-nm width, 2-μm length, and 1-μm height. (H, Right) A schematic illustrates 2 different vertical membrane curvatures: high curvatures at the ends and flat curvature along the sidewalls of a nanobar. (I) An SEM image of a U2OS cell cultured on nanobar arrays outlines the top cell membrane deformed by nanobars. (J) A U2OS cell cotransfected with Life-RFP and GFP-CAAX shows that Lifeact-RFP accumulates on the nanobar ends while GFP-CAAX distributes relatively evenly along the length of the same nanobar (arrowheads). (K) Quantified nanobar end-to-side ratios for Lifeact-RFP and GFP-CAAX, n = 438 nanopillars for both proteins. Welch’s t test (2 tailed, unpaired, assuming unequal SD). Error bars represent SEM. (G and K). (Scale bars, 2 μm [A], 5 μm [B and D], 10 μm [C, E, I, and J], and 1 μm [H].)

