Fig. 3.
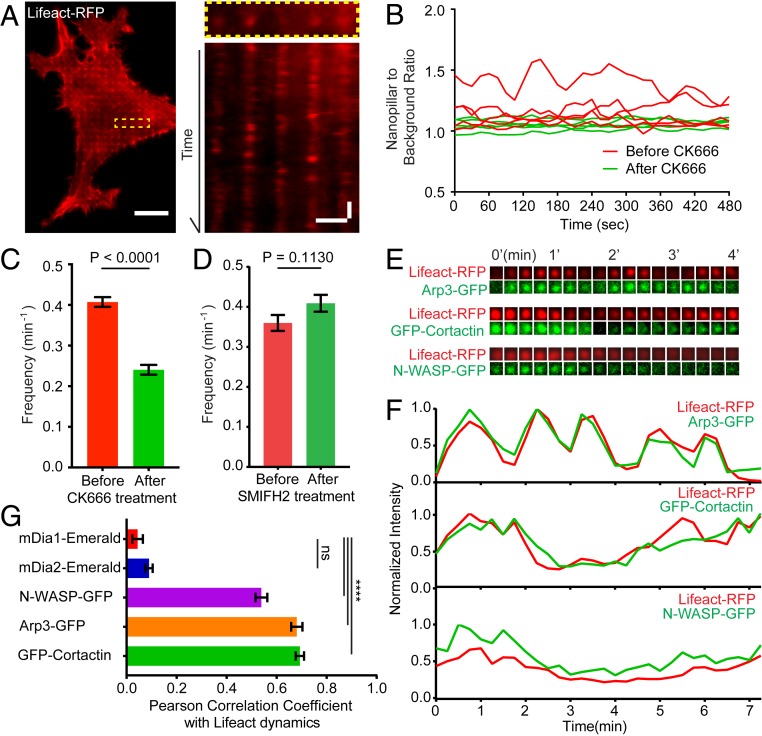
Curvature-dependent F-actin accumulation on nanostructures is highly dynamic. (A, Left) A time-lapse image of a cell transfected with Lifeact-RFP (Movie S1). (A, Right) A kymograph plot shows that Lifeact-RFP signals on nanopillars repeatedly appear and disappear. (B) Representative trajectories of F-actin dynamics before and after CK666 treatment. (C) Kinetic analysis shows that F-actin dynamics on nanopillars are significantly reduced by Arp2/3 inhibitor CK666. (D) A formin inhibitor SMIFH2 does not alter F-actin dynamics on nanopillars. (E and F) Time-lapse images of Lifeact-RFP with Arp3-GFP, Lifeact-RFP with GFP-Cortactin, and Lifeact-RFP with N-WASP-GFP on individual nanopillars with 15-s time interval show correlated dynamic fluctuations. (G) The quantified Pearson correlation coefficient between the dynamics of Lifeact-RFP and 5 F-actin related proteins, n = 89 to 220 trajectories for each protein (see SI Appendix, Table S3 for detailed statistics). Welch’s t test, P values indicated in C, D, and G, ****P < 0.0001; ns = 0.08. Error bars represent SEM. (Scale bar, 10 μm [A, full image], 2 μm [A, kymograph, horizontal), 2 min (A, kymograph, vertical].)

