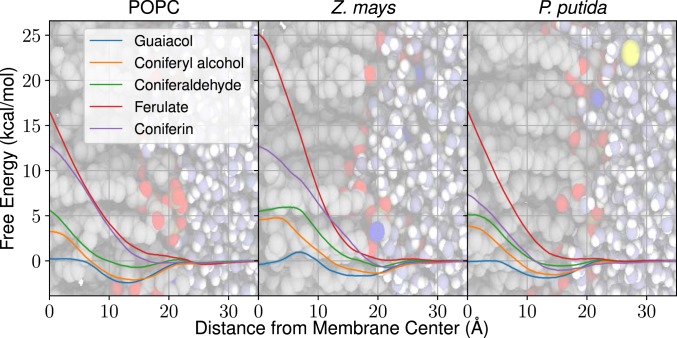
Fig. 2.
Free energy profiles for diverse G-type LRCs in all 3 membrane compositions (POPC [Left], Z. mays [Middle], and P. putida [Right]), using the molecular center of mass distance from the membrane center as the reaction coordinate. Solid lines indicate the position-dependent free energy. Free energy uncertainties (shaded regions, typically on the order of 0.1 kcal mol−1) are determined from a population of 100 Gibbs samples drawn from the complete dataset. The profiles are superimposed on a simulation snapshot showing membrane lipid heavy atoms (gray, carbons; red, oxygens; blue, nitrogens; and brown, phosphorus atoms), water (white, hydrogens, and light blue, oxygens), and ions (yellow). SI Appendix, Figs. S1–S17 include profiles for all studied LRCs, including diffusivity profiles.

