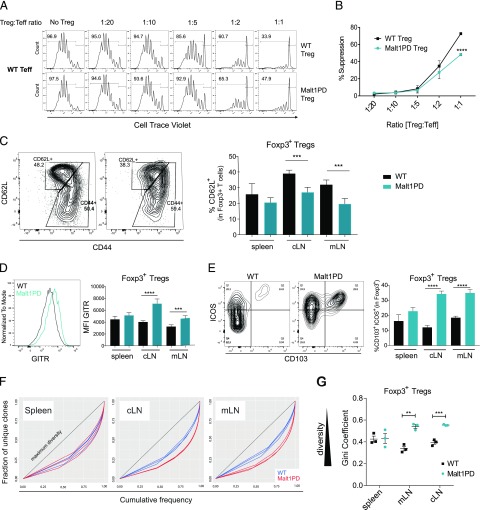
FIGURE 5.
Malt1PD Tregs display a tissue-specific activation pattern and retain partial suppressive capacity. (A) Increasing numbers of WT or Malt1PD CD4+Foxp3EGFP+CD25+ Tregs were added to 105 WT CD4+ Foxp3EGFP−CD25− T cells in presence of nonirradiated BM-derived dendritic cells and an anti-CD3 Ab. The proliferation of Teffs, as measured by dilution of cell trace violet, was assessed after 5 d by flow cytometry. Teffs and Tregs were sorted from pooled LNs and spleen. Data are representative of four independent experiments. (B) Percent suppression relative to Treg/Teff ratios. The results are expressed as the mean ± SEM (n = 3). Statistical differences were determined using two-way ANOVA. (C–E) Expression of activation markers on WT or Malt1PD Foxp3EGFP+ CD4+ Tregs assessed by flow cytometry. The results are expressed as the mean ± SEM (n = 5). Data are representative of three independent experiments. (C) Dot plots showing expression of CD62L versus CD44 in WT or Malt1PD Foxp3EGFP+ Tregs from cLNs. Bar graph displays the proportion of CD62L+ Tregs assessed in the indicated organs. (D) Histogram showing expression of GITR in WT or Malt1PD Foxp3EGFP+ Tregs from cLN. Bar graph displays GITR mean fluorescence intensity on Foxp3EGFP+ Tregs assessed in the indicated organs. (E) Dot plots showing expression of ICOS versus CD103 in WT or Malt1PD EGFP+ Tregs from cLNs. Bar graph displays % CD103+ICOS+ within Foxp3EGFP+ Tregs assessed in indicated organs. (F and G) WT or Malt1PD CD4+ Foxp3EGFP+ Tregs were FACS sorted and subjected to deep sequencing after 5′RACE-based amplification of TCRβ sequences. (F) Lorenz curve visualization of TCRβ sequence diversity in WT or Malt1PD Foxp3EGFP+ Tregs isolated from spleen (left), cLN (middle), and mLN (right). (G) Evaluation of Treg TCRβ sequence diversity based on the Gini coefficient. **p < 0.01, ***p < 0.001, ****p < 0.0001.

