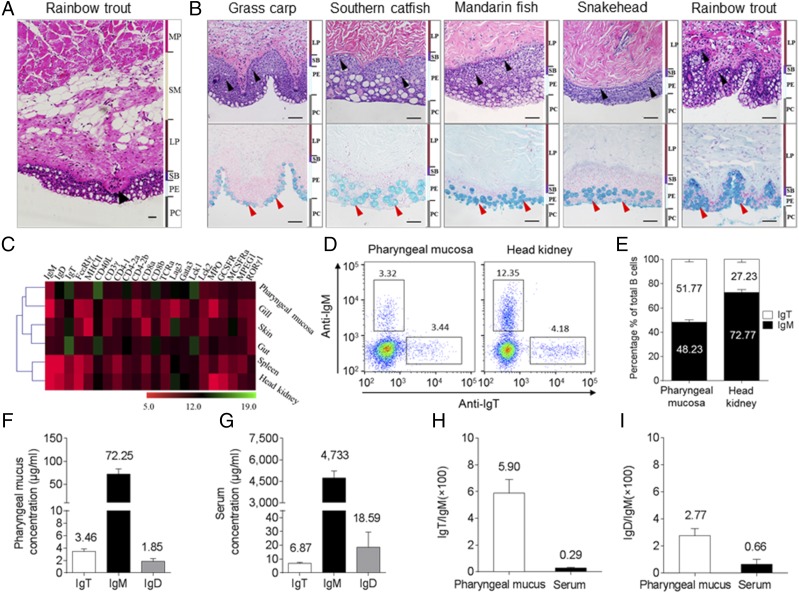
FIGURE 1.
General organization of teleost PM lymphoid tissue. (A) H&E stain of the pharynx of a control adult rainbow trout (O. mykiss). Black arrowhead indicates taste bud. (B) H&E (upper) and Alcian blue (lower) stain of the pharynx from five different families of control adult teleost fish. From left to right: grass carp (C. idellus), southern catfish (S. meridionalis), mandarin fish (S. chuatsi), snakehead (O. argus Cantor), and rainbow trout (O. mykiss). Scale bar, 50 μm. Black and red arrowheads indicate lymphocytes and mucus cells, respectively. (C) Heat map illustrates results from qPCR of mRNAs for selected immune markers in trout skin, gut, gill, pharynx, spleen, and head kidney (n = 6). Data are expressed as mean cycle threshold (Ct) values ± SEM. (D) Flow cytometry analysis of pharynx (left) and head kidney (right) leukocytes stained with anti-IgM and anti-IgT Abs. Numbers in outlined boxes indicate the percentages of IgM+ (top left) and IgT+ (bottom right) B cells in the lymphocyte gate, respectively. (E) Frequency of IgM+ and IgT+ cells among total B cells present in trout pharynx and head kidney. (F and G) Immunoblot and densitometric analysis of the concentration of IgT, IgM, and IgD in pharyngeal mucus (F) and serum (G). (H and I) Ratio of IgT to IgM concentration (H) and IgD to IgM concentration (I) in pharyngeal mucus and serum, calculated from the values shown in (F) and (G), respectively. Results in (E)–(I) are expressed as mean ± SEM obtained from 12 individual fishes. MP, muscularis propria; PE, pharyngeal epithelium; SB, stratum basale; SM, submucosa.

