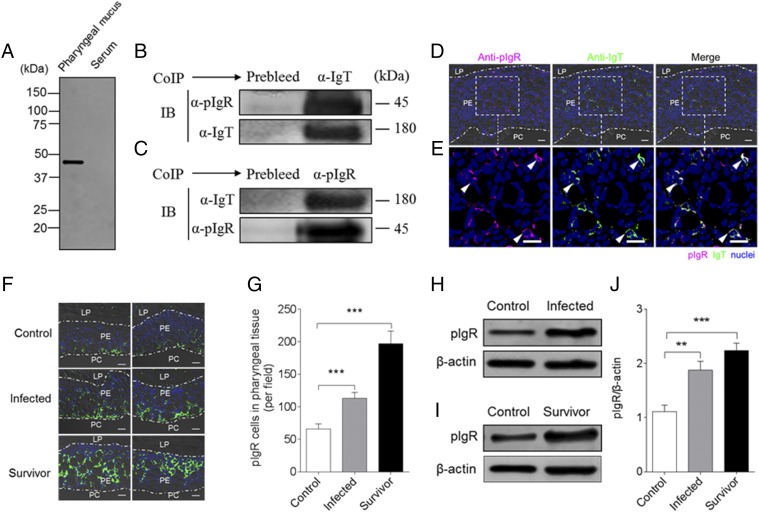
FIGURE 8.
Trout pIgR associates with sIgT in pharyngeal mucus. (A) SDS-PAGE under reducing conditions of trout pharyngeal mucus and serum, followed by immunoblot analysis (IB) using anti-trout pIgR Ab. (B) Coimmunoprecipitation (CoIP) of pharyngeal mucus with rabbit anti-trout IgT Ab, followed by IB under reducing conditions (pIgR detection, upper panels) or nonreducing conditions (IgT detection, lower panels). (C) CoIP of pharyngeal mucus with rabbit anti-trout pIgR, followed by (IB) nonreducing conditions (IgT detection, upper panels) or under reducing conditions (pIgR detection, lower panels). IgG purified from rabbit’s serum before immunization (Prebleed) served as negative control for rabbit anti-trout IgT and rabbit anti-trout pIgR, respectively [left lane on each panel for (B) and (C)]. (D) Immunofluorescence staining for pIgR with IgT in pharynx paraffinic sections of rainbow trout. Differential interference contrast images of pharynx paraffinic sections were stained with anti-trout IgT (green), anti-trout pIgR (magenta), and DAPI for nuclei (blue) (n = 6) (isotype-matched control Abs for anti-pIgR in Supplemental Fig. 2D). (E) Enlarged sections of the areas outlined in (D) without differential interference contrast (DIC) showing some pIgR/IgT colocalization (white arrowhead). Data are representative of at least three independent experiments. Scale bar, 20 μm. (F) Two different DIC images of immunofluorescence staining for pIgR (green) on pharynx paraffinic sections from uninfected control fish (left), infected fish (middle), and survivor fish (right); nuclei are stained with DAPI (blue) (n = 9). Data are representative of at least three independent experiments. Scale bar, 20 μm. (G) Counts of pIgR cells per field (counted in 27 fields) in paraffinic sections of pharynx from uninfected control fish, infected fish, and survivor fish. (H) Representative IB of pIgR (upper panels) in pharyngeal mucus from uninfected control fish (left) and infected fish (right). (I) Representative IB of pIgR (upper panels) in pharyngeal mucus from uninfected control fish (left) and survivor fish (right). β-Actin was used as a loading control [lower lane on each panel for (H) and (I)]. (J) These data in (H) and (I) were quantified by densitometry, followed by normalization to the β-actin loading control (n = 9). Data are representative of at least three independent experiments (mean ± SEM). **p < 0.01, ***p < 0.001 (unpaired Student t test).

