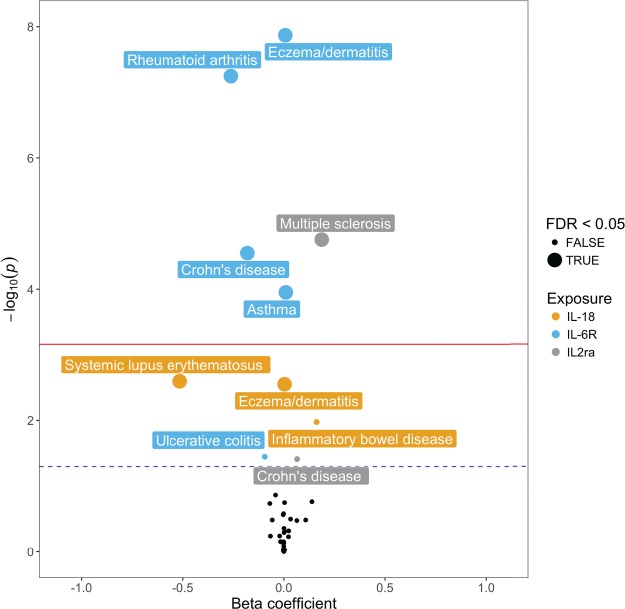
Figure 1.

Conservative MR analysis detects associations between circulating inflammatory biomarkers and IMDs. Volcano plot of conservative MR analysis illustrating associations between inflammatory cytokines and complex traits. Red (upper) line represents Bonferroni corrected threshold (P ≤ 6.17 × 10⁻⁴) and black dotted line (bottom) represents unadjusted threshold (P ≤ 0.05).
