
Figure 1.
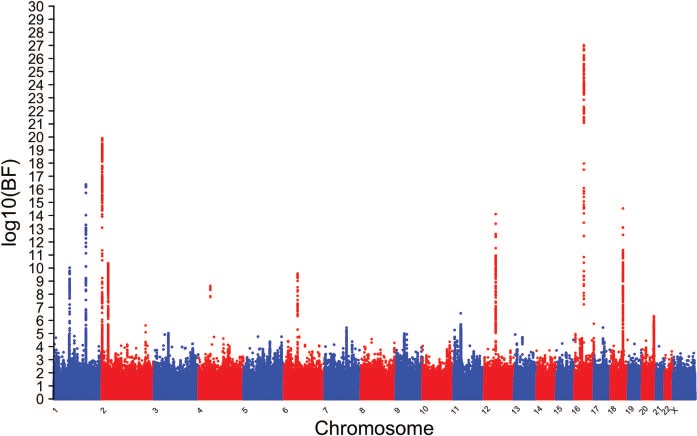
Manhattan plot of the trans-ancestral meta-analysis of the childhood obesity Stage 1 results. BF <0 have been represented by a value of 0. The y-axis is the log10 of the BF. Sentinel SNPs from loci that achieved at least log10 BF ≥ 4 were taken forward to Stage 2.