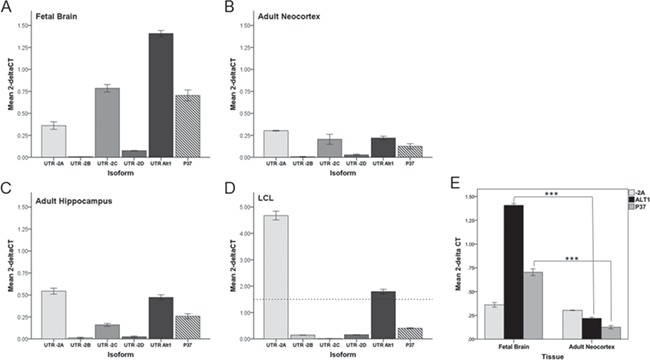
Figure 3.

PIK3CD isoform expression is tissue- and development-stage specific. Quantitative analysis of PIK3CD isoform transcripts as measured by real-time qRT-PCR in fetal brain (A), adult neocortex (B), adult hippocampus (C), and LCL (D). (E) Statistical comparison of transcript expression between fetal brain and adult neocortex of variants differentially expressed in SZ (see Fig. 4), (***P < 0.00001). Transcript expression (cycle threshold (Ct) values) was normalized to PBGD (2-Δ CT). Error bars represent ±1 SEM for triplicate analysis from each tissue. Note difference in scale between neural tissues and LCL; dotted line in (D) denotes top of scale bar for (A)–(C) and (E).
