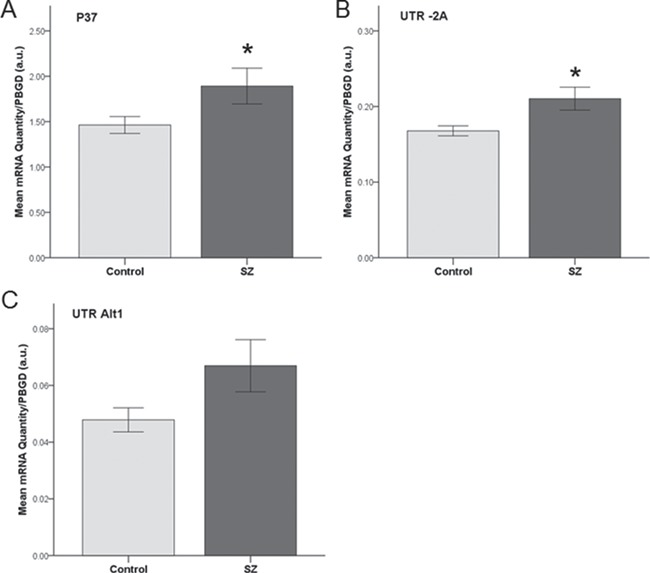
Figure 4.

PIK3CD alternative transcript expression is increased in SZ. Quantitative analysis of PIK3CD isoform transcripts P37 (A), UTR-2A (B), and UTR Alt1 (C) as measured by qRT-PCR in LCLs from patients with SZ (n = 30) or normal controls (n = 30). All values were extrapolated using the standard curve method and normalized to PBGD. au, arbitrary units. Error bars represent ±1 SEM. *Represents P ≤ 0.05.
