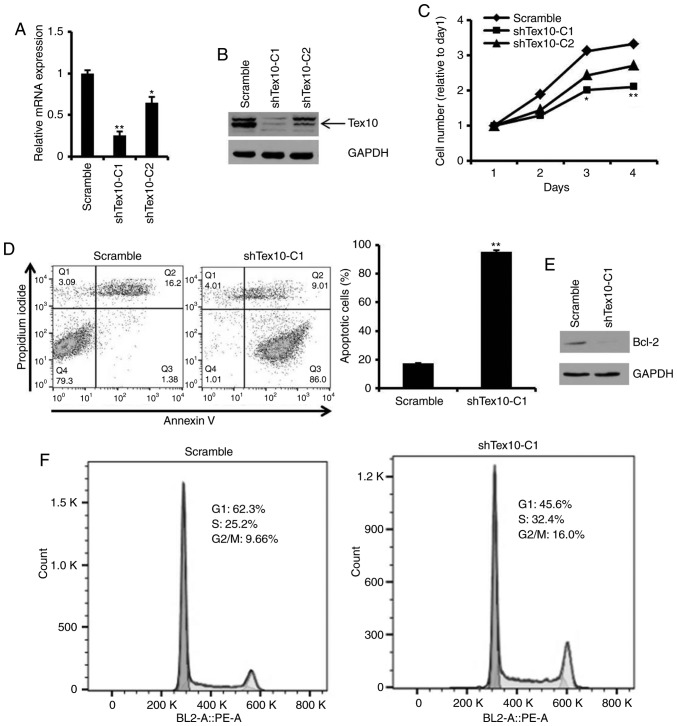
Figure 2.
Silencing of Tex10 inhibits cell proliferation, induces apoptosis and arrests the cell cycle in EC109 cells. (A) The mRNA level of Tex10 was verified in sorted EC109 cells following transfection. Error bars represent the means ± SD of 3 independent experiments. One-way ANOVA followed by the Bonferroni test was used to determine the statistical significance of the differences. *P<0.05 and **P<0.01, significant difference vs. scramble group. (B) Western blot analysis for the detection of Tex10 protein expression in the constructed EC109 cells. GAPDH was used as a loading control. (C) Cell viability was evaluated at the indicated time points using CCK-8 assay. One-way ANOVA followed by the Bonferroni test was used to determine statistical significance. *P<0.05 and **P<0.01, significant difference vs. scramble group. (D) Cell apoptosis was measured by flow cytometric analysis. Error bars represent the means ± SD of 3 independent experiments. Two-tailed unpaired Student's t-test was used to determine statistical significance. **P<0.01, significant difference vs. scramble group. (E) Protein expression levels of Bcl-2 after Tex10 knockdown. (F) Cell cycle was examined by flow cytometric analysis. Tex10, testis expressed 10.

